• Home
  • Forums
  • Trades
  • News
  • Calendar
  • Market
  • Brokers
  • Login
  • Join
  • User/Email: Password:
  • 5:54pm
Menu
  • Forums
  • Trades
  • News
  • Calendar
  • Market
  • Brokers
  • Login
  • Join
  • 5:54pm
Sister Sites
  • Metals Mine
  • Energy EXCH
  • Crypto Craft

Options

Bookmark Thread

First Page First Unread Last Page Last Post

Print Thread

Similar Threads

People say systems don't work (only pure price action does) 93 replies

Pure Price Action Trading 281 replies

Pure Price Action 19 replies

Pure Price Action Trading - NO lines or indicators 49 replies

Pure Price Action: Predicting the Current Move 9 replies

  • Trading Discussion
  • /
  • Reply to Thread
  • Subscribe
  • 2
Attachments: Recent Support and Resistance with pure Price Action
Exit Attachments
Tags: Recent Support and Resistance with pure Price Action
Cancel

Recent Support and Resistance with pure Price Action

  • Last Post
  •  
  • Page 1 2
  • Page 1 2
  •  
  • Post #1
  • Quote
  • First Post: Jul 9, 2020 7:58am Jul 9, 2020 7:58am
  •  Luciferz
  • | Joined May 2018 | Status: Member | 19 Posts
Hello, there I'm opening this thread to discuss trading in recent S/R areas with only price action because I believe that keeping trading simple and clean without any indicators/scripts it's much more beneficial because the more confluence you have in your chart the more difficult is to take an entry hence one confluence could say to buy and the other confluence could say to sell.
I think if you know how to read candles(price action) you don't need any type of indicator.

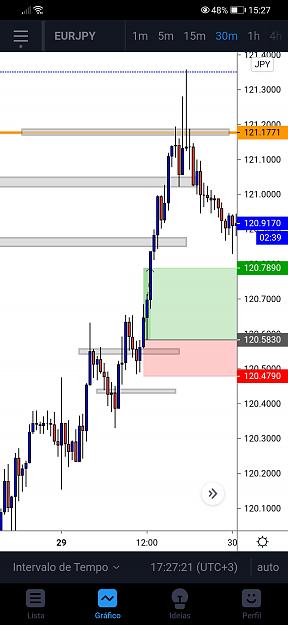
The only thing I'm happy to use its recent Support and Resistance areas because they are just areas where price had any sort of issues in the recent past so what's the probability of when the price goes back to that S/R area it will reject or retrace a bit to reverse or to "breath" to go higher breaking that S/R area.

I also know that market moves in HH and HL(vice-versa) so technically you can spot the direction of the price in that timeframe.

My issues are that which support and resistance areas work and which don't because for example once resistance breaks that become support but a candle closes below that new support then does that mean that price is now changing direction? The HL it's not broken yet so technically it should still be a buy?

Happy to discuss to hear more opinions about it.

Luciferz
  • Post #2
  • Quote
  • Jul 9, 2020 8:41am Jul 9, 2020 8:41am
  •  Shabs19
  • Joined Aug 2006 | Status: Member | 3,589 Posts | Online Now
I would say both recent & long term S&R is valid. I would advise to look at the charts from 1hr & upwards to see enough information.
You can trade this information in lower TF's to get better MM.
Follow the Money
 
 
  • Post #3
  • Quote
  • Jul 9, 2020 8:51am Jul 9, 2020 8:51am
  •  Luciferz
  • | Joined May 2018 | Status: Member | 19 Posts
Quoting Shabs19
Disliked
I would say both recent & long term S&R is valid. I would advise to look at the charts from 1hr & upwards to see enough information. You can trade this information in lower TF's to get better MM.
Ignored
Aham I've heard that in order to give more strength on your support and resistance areas you need to start marking them on the higher time frame and then going to lower tfs by adjusting them according to the timeframe and understanding what the candles are trying to say.

You adjust them according to the time frames areas because it does make any sense having large zones in your chart from the daily if you are taking entries on the 15M. You can take in mind that we are at support or resistance on daily but it doesn't make sense having a zone big zone there that's why adjusting the zones makes sense.

The more scenarios you plan for your trade the better and more prepared you'll be when executing so once I reach to the lower time frames and I look left then I find a lot resistances that used to support once and then I don't know which ones work out and which don't.

Doing these analysis on the charts for months I've concluded that it makes sense and kinda works this whole concept but the problem is that some times the recent Support transformed into resistance gets respected and sometimes price just goes through as there wasn't anything there. There is some kind a logic behind it but I cannot figure it out yet.
 
 
  • Post #4
  • Quote
  • Jul 9, 2020 9:08am Jul 9, 2020 9:08am
  •  KeenPips
  • Joined Dec 2015 | Status: Member | 7,355 Posts
First, it's not about what makes sense, but what works. Second, you don't trade an area just because candlesticks have reached it or broken it down or up, you wait for a validation of the area by price action. Third, S/Rs on htfs are far more reliable than on ltfs; and they can be used for tps on ltfs.

Stay safe, trade safe.

KP

Quoting Luciferz
Disliked
{quote} Aham I've heard that in order to give more strength on your support and resistance areas you need to start marking them on the higher time frame..You adjust them according to the time frames areas because it does make any sense having large zones in your chart from the daily if you are taking entries on the 15M...it doesn't make sense having a zone big zone there that's why adjusting the zones makes sense....
Ignored
Do your homework, follow the footprints of smart money
 
3
  • Post #5
  • Quote
  • Jul 9, 2020 9:42am Jul 9, 2020 9:42am
  •  Shabs19
  • Joined Aug 2006 | Status: Member | 3,589 Posts | Online Now
Quoting Luciferz
Disliked
{quote} There is some kind a logic behind it but I cannot figure it out yet.
Ignored
The name of the game is probabilities. You have to think in probablities.
Currency pairs are always in a range of some sort be it a daily, weekly or monthly range.
When your price approaches the extremes of these ranges, what will it do ?
Reverse or breakthrough, that is where PA will help you to determine what your next move is.
Follow the Money
 
2
  • Post #6
  • Quote
  • Jul 9, 2020 10:14am Jul 9, 2020 10:14am
  •  Luciferz
  • | Joined May 2018 | Status: Member | 19 Posts
Quoting KeenPips
Disliked
First, it's not about what makes sense, but what works. Second, you don't trade an area just because candlesticks have reached it or broken it down or up, you wait for a validation of the area by price action. Third, S/Rs on htfs are far more reliable than on ltfs; and they can be used for tps on ltfs. Stay safe, trade safe. KP {quote}
Ignored


But in order for something to work you cannot simplify keep doing something without understanding why is that happening other wise in the long run there will be a time that what you are doing will stop working and you'll ask yourself why is not working without knowing the why, that's why I meantioned about understanding what the candles are trying to say.

I agree with your second point, the confirmations that I usually wait for are I wait for candles to create some kind of support/resistance to take an entry having the stops right below those candles.

The idea behind this is that for example if we know price moves in HH and HL then if the bias on the higher timeframes it's bullish then you need to wait for some sort of support to be formed and expect it to go higher.

For example have a resistance, a candles closes above that resistance you won't buy straight away hopping to go to your next resistance area. You'll wait for price to create a high first and wait for candles to start closing in your direction. If a bullish candle closes then I know alright we are forming support to go up. If we break this level then that means that if are not going up or probably it's just a fake out. This way your stops it's not that big and you understand what you are doing instead of taking buys or sells "blindly" if that makes sense. It's all about probabilities as someone said here.

My plan is to aim for 10 pips with 10 pips Sl and get quickly out of the market.

Candles closing in your direction increase the probability of your trade to be successful.
 
 
  • Post #7
  • Quote
  • Jul 9, 2020 10:33am Jul 9, 2020 10:33am
  •  Luciferz
  • | Joined May 2018 | Status: Member | 19 Posts
A graphical example of what I'm saying it's here, you can see price broke above closing down. It came down and created some kind of support when that 30M candle closed so if price moves in HH and HL then technically it should not break the low of that bullish candle and continue going up.
That high created gets likely to be broken as price has momentum to go up hence it you notice price was bullish almost all day creating HH and HL.

And then if you notice price never came back to break the low of that bullish candle and kept going up.
Attached Image (click to enlarge)
Click to Enlarge

Name: Screenshot_20200709_152723_com.tradingview.tradingviewapp.jpg
Size: 318 KB
 
 
  • Post #8
  • Quote
  • Jul 9, 2020 10:47am Jul 9, 2020 10:47am
  •  pakeha
  • Joined Sep 2011 | Status: Member | 416 Posts
Quoting Shabs19
Disliked
{quote} The name of the game is probabilities. You have to think in probablities. Currency pairs are always in a range of some sort be it a daily, weekly or monthly range. When your price approaches the extremes of these ranges, what will it do ? Reverse or breakthrough, that is where PA will help you to determine what your next move is.
Ignored
Agree totally. We have no idea whether the price will reverse or break-through at S/R levels (or any level for that matter).

So there is two ways to deal with that uncertainty.
1. place a hedge trade at the level (then you don't care what direction price goes)
2. wait and determine the subsequent direction from price action or some other means
Neither approach is perfect, but with a disciplined approach can be profitable.

The use of HTF levels (which I use) is simply to give you enough room between the levels to make some profit.
 
 
  • Post #9
  • Quote
  • Jul 9, 2020 11:03am Jul 9, 2020 11:03am
  •  Luciferz
  • | Joined May 2018 | Status: Member | 19 Posts
Quoting pakeha
Disliked
{quote} Agree totally. We have no idea whether the price will reverse or break-through at S/R levels (or any level for that matter). So there is two ways to deal with that uncertainty. 1. place a hedge trade at the level (then you don't care what direction price goes) 2. wait and determine the subsequent direction from price action or some other means Neither approach is perfect, but with a disciplined approach can be profitable. The use of HTF levels (which I use) is simply to give you enough room between the levels to make some profit.
Ignored
That's the thing I'm not trying to call a top or a bottom. I'm trying to trade de trend. I agree with you that we don't know if S/R areas will hold or not that's why we wait for those areas to be broken and then trade so you can add some kind of confluence that alright price has broken a resistance and now after it creates a support then I can take an entry with my stop below.

To do this you need to see the direction on the higher timeframes which will add confluence plus time time which you trade can also add a confluence. Times such as sessions opening or pre sessions are high volume so more than likely that all that volume comes in the market it will push the market if the direction the candles are closing, in this case upwards.

Yes I also agree that with disciplined approach and with more understanding it's possible. That's why I created this thread to discuss about and hopefully we can all learn something.

Yup it depends on your plan of how many pips you are aiming for. To get in and out for 10 pips 30M tf for entries it's good but you can use 1h 4h but it will just take longer.
 
 
  • Post #10
  • Quote
  • Jul 9, 2020 11:20am Jul 9, 2020 11:20am
  •  pakeha
  • Joined Sep 2011 | Status: Member | 416 Posts
If you are trading S/R, or any kind of level for that matter, you are trading breakout or reversal - that's it!. Whether it is the top or a bottom or a trend continuation is secondary - frankly, why do you care?

Further, the direction on a higher timeframe is no guarantee that the same will occur on the lower time-frame, just like there is no guarantee that there will be a breakout or reversal at a specific level.

As an FYI I use monthly and weekly levels and trade on the daily timeframe. Again, the only reason I use HTF levels is to give me enough room to make some profit.
 
 
  • Post #11
  • Quote
  • Jul 9, 2020 11:33am Jul 9, 2020 11:33am
  •  Shabs19
  • Joined Aug 2006 | Status: Member | 3,589 Posts | Online Now
Quoting Luciferz
Disliked
{quote} Yes I also agree that with disciplined approach and with more understanding it's possible.
Ignored
You have to now work out what makes one S/R zone stronger than another.
A short term S/R within a larger term S/R maybe ?
How about Daily, Weekly & Monthly Highs & Lows ?
Follow the Money
 
 
  • Post #12
  • Quote
  • Jul 9, 2020 11:47am Jul 9, 2020 11:47am
  •  unknown7
  • | Joined Jul 2017 | Status: I can do it | 27 Posts
I think the million-dollar question is when a S/R breaks, is really a break or is just a fakeout...

If you know this, then you know which lines work or not.
 
 
  • Post #13
  • Quote
  • Jul 9, 2020 11:56am Jul 9, 2020 11:56am
  •  unknown7
  • | Joined Jul 2017 | Status: I can do it | 27 Posts
Quoting Shabs19
Disliked
{quote} You have to now work out what makes one S/R zone stronger than another. A short term S/R within a larger term S/R maybe ? How about Daily, Weekly & Monthly Highs & Lows ?
Ignored
I've head different types of comments regarding stronger zones: the more is being tested the stronger it becomes, but I also heard saying the more it gets tested the weaker it becomes.

Again we come back to the same starting point, did it hold or it's a fake?

And when you realize that, in fact, it did hold, it might be too late to enter and the risk-reward ratio can suffer depending on your levels.
 
 
  • Post #14
  • Quote
  • Jul 9, 2020 12:02pm Jul 9, 2020 12:02pm
  •  Luciferz
  • | Joined May 2018 | Status: Member | 19 Posts
Quoting pakeha
Disliked
If you are trading S/R, or any kind of level for that matter, you are trading breakout or reversal - that's it!. Whether it is the top or a bottom or a trend continuation is secondary - frankly, why do you care? Further, the direction on a higher timeframe is no guarantee that the same will occur on the lower time-frame, just like there is no guarantee that there will be a breakout or reversal at a specific level. As an FYI I use monthly and weekly levels and trade on the daily timeframe. Again, the only reason I use HTF levels is to give me enough...
Ignored

You never know when a reversal it's going to happen. If price is treading up then would you sell blindly thinking "ohhh price came to a resistance let's sell now"?? No, that's calling a top. You'll wait for for some kind of support to form and wait to break, retest and then enter.

Now you ask me why? It's because you have to read the candles. Price came to a resistance and stopped. If it had to continue then it would continue why would it stop there? Then price created a support at resistance so now you have some kind of range going on. Now if a candle closes below that zone, creates a resistance and the candle closes bearish that means that price failed to break the first resistance and now it's rejecting that area to go down. You have to tell a story behind you analysis.

Now the probably of going down it's higher no matter if it's just for a retracement on the higher time frame or a reversal understand?

I totally agree that on higher time frame the direction can be different then the other that's why you have a support marked on your lower time frames and a resistance so you can trade both scenarios. If it breaks above then you see how it makes sense on the higher time frames and same for the lower. Sticking to only one side of the trade limits you of taking the opposite trade.

Sometimes you analyze to take buys and you are waiting for a break above but that never happens and price goes on the opposite direction. Why is that? Because you were only focusing on the buys.
 
 
  • Post #15
  • Quote
  • Jul 9, 2020 12:05pm Jul 9, 2020 12:05pm
  •  Luciferz
  • | Joined May 2018 | Status: Member | 19 Posts
Quoting Shabs19
Disliked
{quote} You have to now work out what makes one S/R zone stronger than another. A short term S/R within a larger term S/R maybe ? How about Daily, Weekly & Monthly Highs & Lows ?
Ignored
Aham that's what I'm trying to figure it out which zones are valid and which ones aren't.

Monthly and weekly zones are too far away from the 30M tf so that does not help to take entries.
 
 
  • Post #16
  • Quote
  • Jul 9, 2020 12:17pm Jul 9, 2020 12:17pm
  •  Shabs19
  • Joined Aug 2006 | Status: Member | 3,589 Posts | Online Now
Quoting Luciferz
Disliked
{quote} Aham that's what I'm trying to figure it out which zones are valid and which ones aren't. Monthly and weekly zones are too far away from the 30M tf so that does not help to take entries.
Ignored
There are intraday S/R levels also, you mentioned market opens/closes, News Events that occur most days or at the minimum weekly events.

You have to put in the time to work out what levels are going to hold / break and more importantly what you are going to do when that occurs.
Follow the Money
 
 
  • Post #17
  • Quote
  • Jul 9, 2020 1:30pm Jul 9, 2020 1:30pm
  •  pakeha
  • Joined Sep 2011 | Status: Member | 416 Posts
Quoting Luciferz
Disliked
{quote} Aham that's what I'm trying to figure it out which zones are valid and which ones aren't. Monthly and weekly zones are too far away from the 30M TF so that does not help to take entries.
Ignored
The only way you will figure out why price will breakout or reverse is by understanding context (fundamentals and sentiment) and by knowing order flow. Since you don't know order flow then its only context.

If you are a technical trader only (don't trade fundamentals/sentiment) then you are back to trading levels either by hedging the level and/or by trading price action around a level. Of course, there can be false moves (breakouts or reversals) but that is why you need to have a disciplined approach with a well-thought-out stop loss strategy.

If you are trading the 30 min TF I would suggest that you use daily levels. Remember, daily levels and above avoid the intra-day dynamics of the 3 main trading sessions.
 
 
  • Post #18
  • Quote
  • Jul 16, 2021 7:57am Jul 16, 2021 7:57am
  •  romulorios
  • | Joined Dec 2020 | Status: Exit | 249 Posts
Quoting KeenPips
Disliked
First, it's not about what makes sense, but what works. Second, you don't trade an area just because candlesticks have reached it or broken it down or up, you wait for a validation of the area by price action. Third, S/Rs on htfs are far more reliable than on ltfs; and they can be used for tps on ltfs. Stay safe, trade safe. KP {quote}
Ignored

I believe you are an experienced trader. Could you point me to something to study?
 
 
  • Post #19
  • Quote
  • Jul 16, 2021 2:08pm Jul 16, 2021 2:08pm
  •  here2there
  • Joined Dec 2019 | Status: Moving on... | 5,368 Posts
Quoting Luciferz
Disliked
{quote} Aham I've heard that in order to give more strength on your support and resistance areas you need to start marking them on the higher time frame and then going to lower tfs by adjusting them according to the timeframe and understanding what the candles are trying to say. You adjust them according to the time frames areas because it does make any sense having large zones in your chart from the daily if you are taking entries on the 15M. You can take in mind that we are at support or resistance on daily but it doesn't make sense having a zone...
Ignored
If you are trading the 15 minute chart, then perhaps it would be better to draw your support and resistance lines from H1 (using fractals as a guide).
You don't know because you don't ask.
 
 
  • Post #20
  • Quote
  • Jul 16, 2021 3:54pm Jul 16, 2021 3:54pm
  •  romulorios
  • | Joined Dec 2020 | Status: Exit | 249 Posts
Quoting here2there
Disliked
{quote} If you are trading the 15 minute chart, then perhaps it would be better to draw your support and resistance lines from H1 (using fractals as a guide).
Ignored

I never understood that term of "using fractals as a guide". Could you explain better?
 
 
  • Trading Discussion
  • /
  • Recent Support and Resistance with pure Price Action
  • Reply to Thread
    • Page 1 2
    • Page 1 2
0 traders viewing now
  • More
Top of Page
  • Facebook
  • Twitter
About FF
  • Mission
  • Products
  • User Guide
  • Media Kit
  • Blog
  • Contact
FF Products
  • Forums
  • Trades
  • Calendar
  • News
  • Market
  • Brokers
  • Trade Explorer
FF Website
  • Homepage
  • Search
  • Members
  • Report a Bug
Follow FF
  • Facebook
  • Twitter

FF Sister Sites:

  • Metals Mine
  • Energy EXCH
  • Crypto Craft

Forex Factory® is a brand of Fair Economy, Inc.

Terms of Service / ©2023