One Hour Trend Trading System on EURUSD
One picture being better than one thousand words...
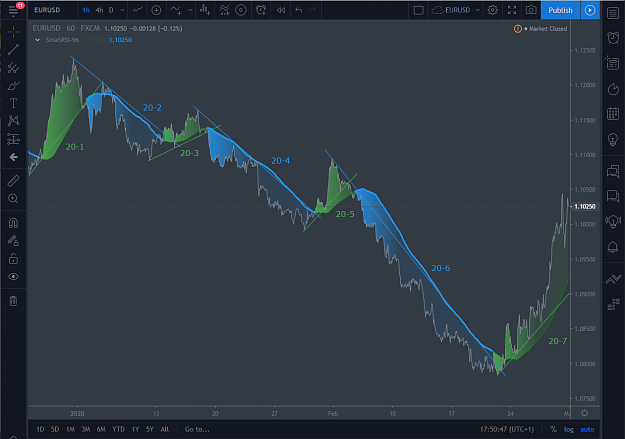
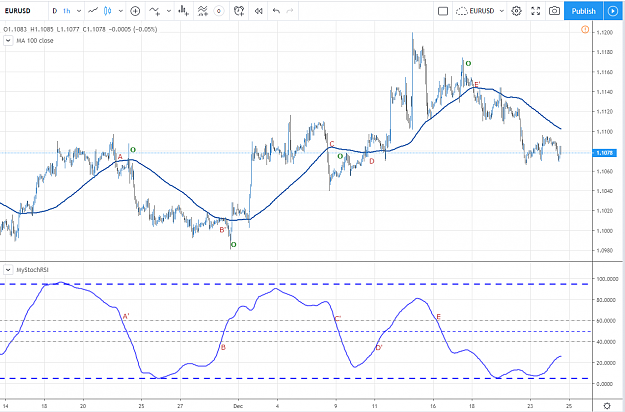
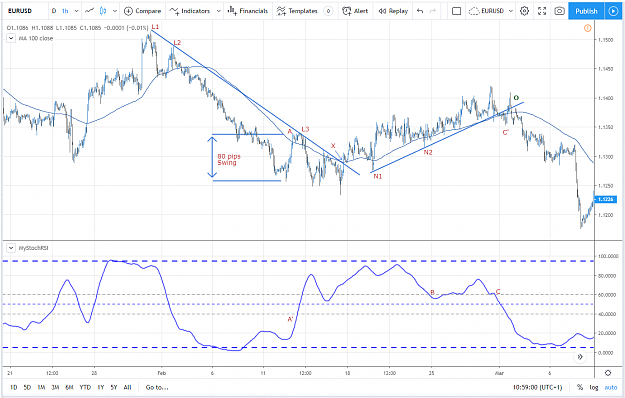
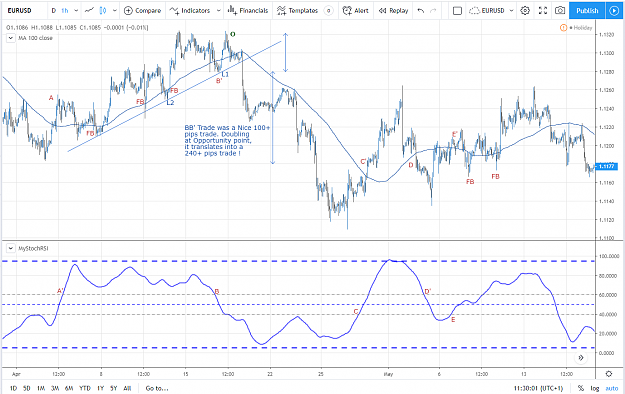
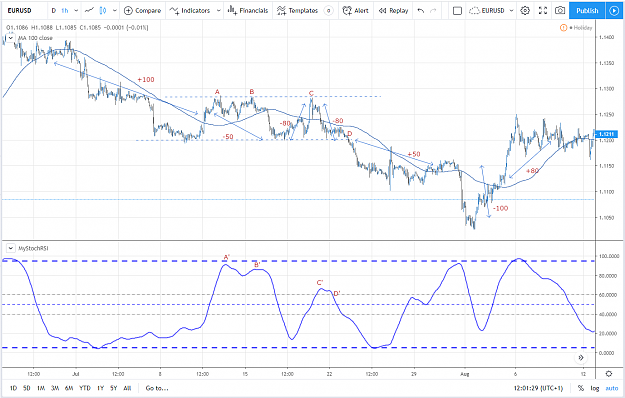
These are the first seven trends of 2020 as of Begin of March 2020.
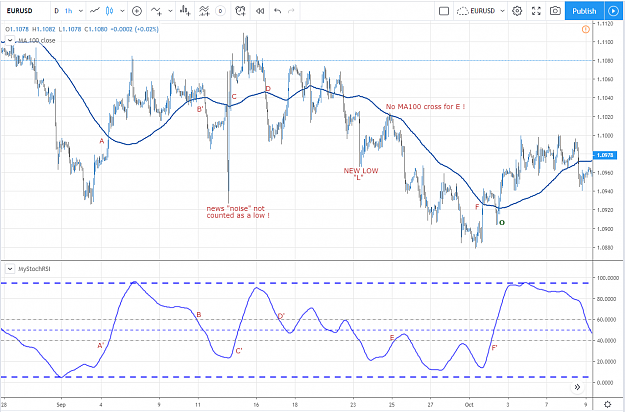
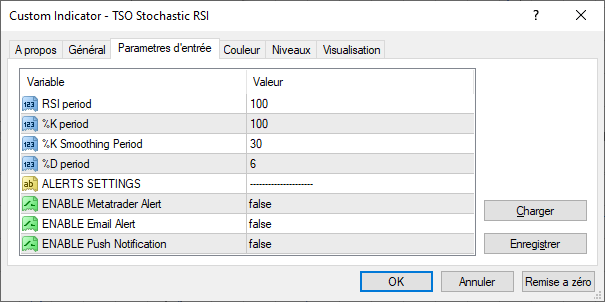
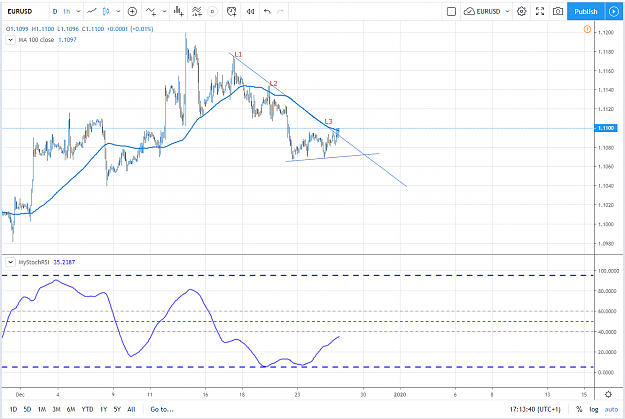
The system uses a Simple Moving Average (SMA) coupled with a Stochastic RSI (SRSI) calculated over a period of 96 hours to signal trends like shown in the chart above. It does so when the price is above SMA and SRSI is above 40 for a bull trend or when price is below SMA and SRSI below 60 for a bear trend.
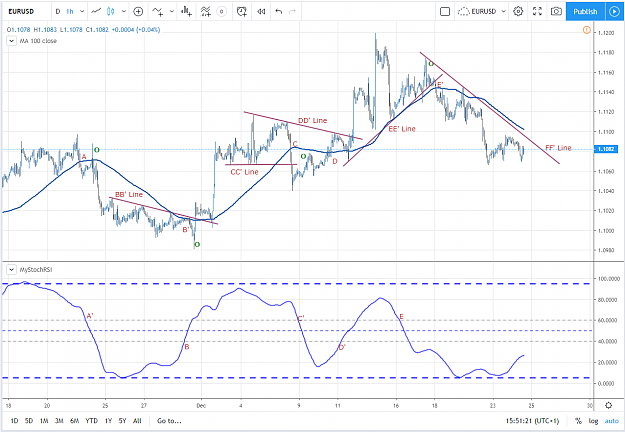
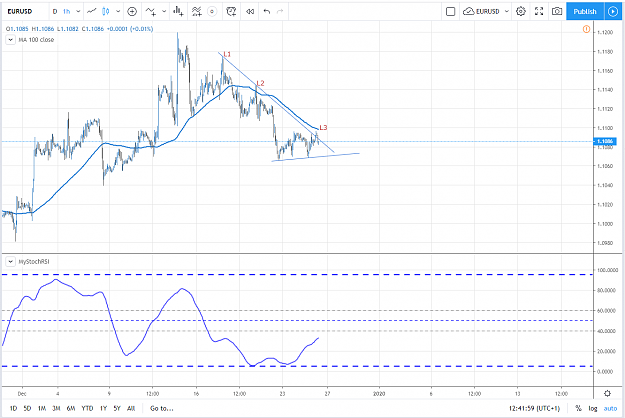
Once a new trend begins, it's important to draw the corresponding trend line in the following hours or days. Trends are used to avoid false entries, which can exist when a new trend is signaled without the previous trend line being broken or to confirm them when they are broken.
This system has been created and adjusted for EURUSD only and occasionally EURJPY. No other pair will be traded, discussed here.
The entry is simply when a new trend appears, the exit is at your own discretion but the last call is when a contrary signal (opposite trend) appears.
Please note that Money management, Risk, SL, etc will not be discussed here as everyone is responsible for the risk (s)he can afford.
* * * * * * * * * * * * * * * * * * * * * * * * * * * * *
Before posting, please consider the following :
- Before posting anything, please, at least read the first 10 pages of the thread, any question coming later that was already answered in those first 10 pages, will simply be ignored.
. - Please be polite and respectful to everyone like we all are in real life.
. - Please don't post charts or other material not related with the system or of different pairs.
. - Please don't add your own rules and/or indicators to the system.
Know that the non respect of these rules can ban you from the thread.
* * * * * * * * * * * * * * * * * * * * * * * * * * * * *
That's all for the description and rules. If you want to give it a try, I would be glad to hear from, or help you if needed.
PS. Posts #2 to #178 show the original system when SMA and SRSI were charted separately. The actual system merges both indicators into one shown on the price window, it tests the condition of a new trend and changes the SMA and fill color between SMA and price when it detects one.
Note also that I was using SMA-100 at the beginning and this was then changed later to SMA-96, so don't get confused if you see in the earlier posts SMA-100, it's SMA-96 that is used now.
Latest versions of Indicators for MT4 :
Latest versions of Indicators for Trading View :
Upgraded 2021 version which removes a bit of noise.