ALL ABOUT INDICATOR AND MANUAL SETUPS
Hi.. Hello..
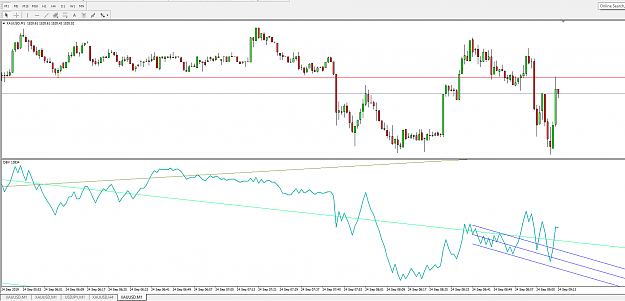
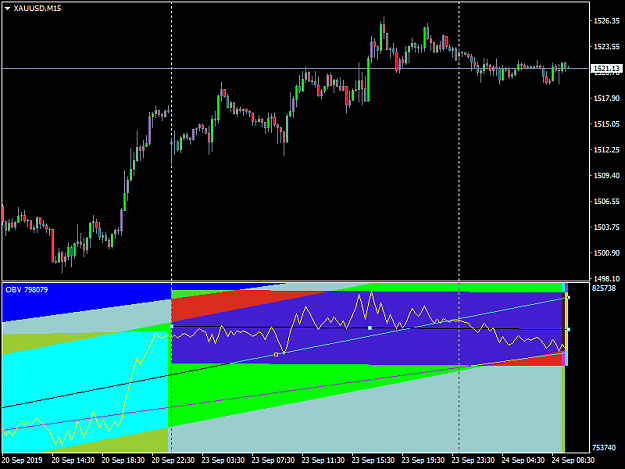
Well i would like to start this experiment, I tried trading this indicator together with regression channel. Basically the strategy is to trade on the break out and rejections or what do you call extremes
What do you need:
- Mobile device/PC(well you can do it also in your pc if you want still this is an experiment.)
- On balance volume indicator.
- Regression channel.
How to set up:
W1: Plot the channel on the current period on indicator window.
D1: Plot the channel on the three current periods on indicator window.
H4: Plot the channel on the three current periods on indicator window.
H1: Plot the channel on the three current periods on indicator window.
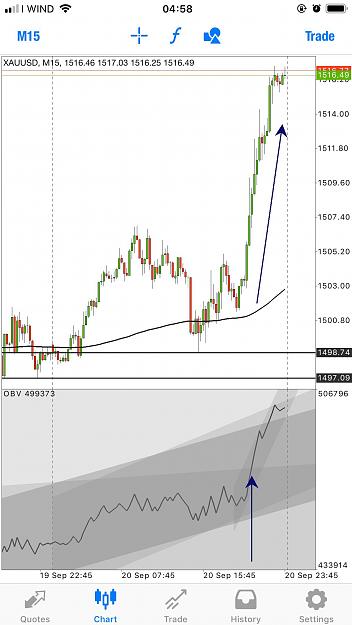
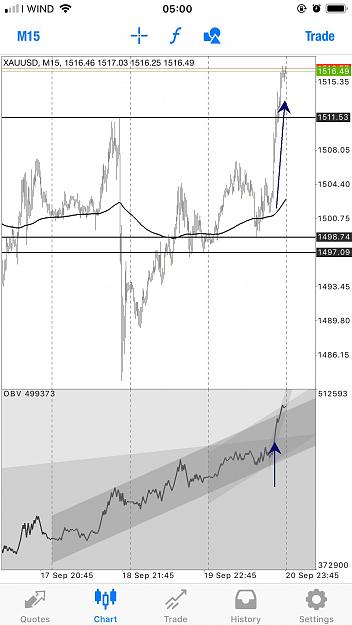
15M: Plot the channel on the current period on indicator window.
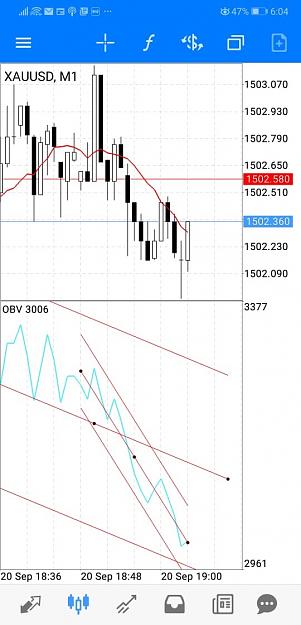
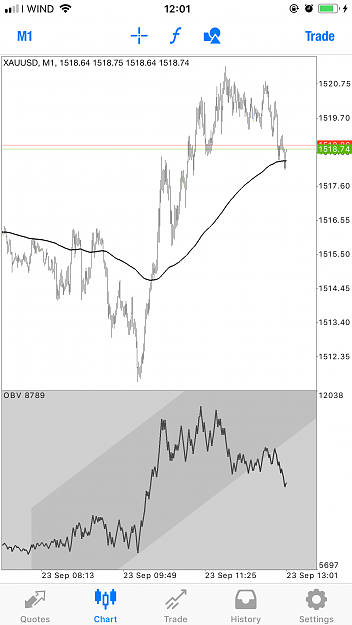
1M: Plot the channel on the latest swing of the trend on indicator window.
How to trade:
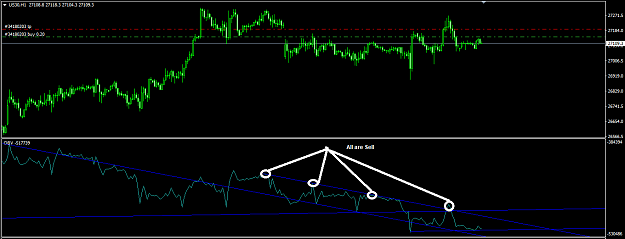
- There are two ways to trade this strategy, first is by the rejection of the OBV from the lower/upper channel.
- We short if the OBV is rejected from the upper channel.
- We long if the OBV is rejected from the lower channel.
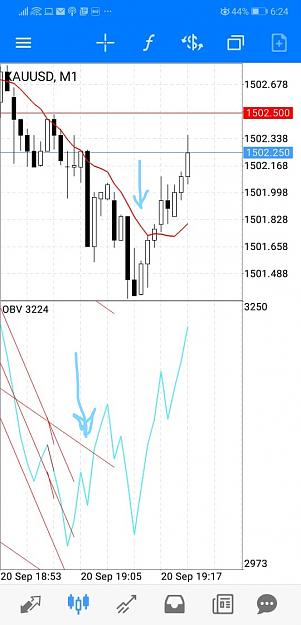
- The second way to trade this strategy, is by the breakout of OBV from the channel.
- We short if the OBV made a breakout from the channel and moves below the channel.
- We long if the OBV made a breakout from the channel and moves above the channel.
A video how to do it:
Inserted Video
Applying Divergence using OBV:
Inserted Video
and a daily video trading it live, just check the comments below.
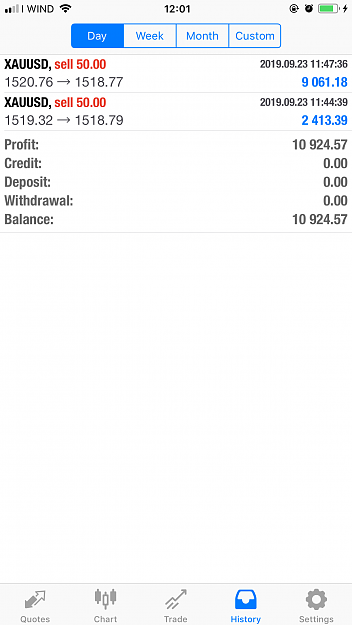
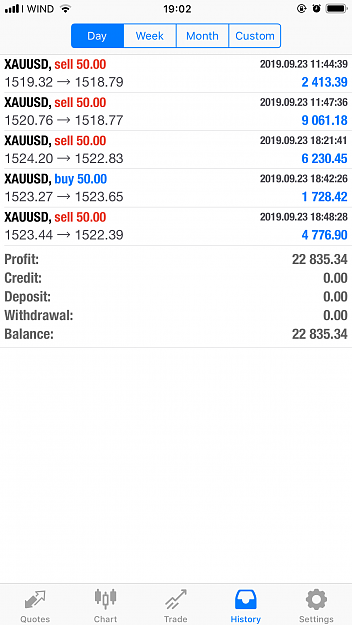
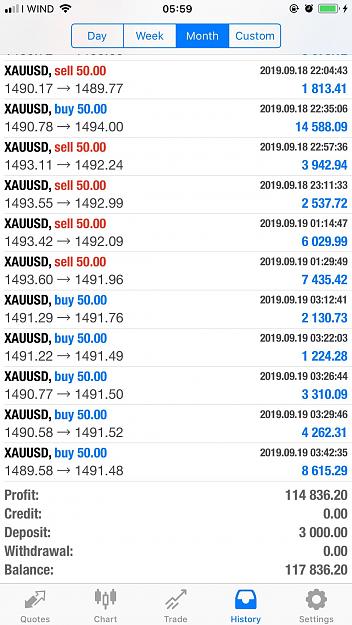
PS: All of this are experiment. As you can see on my TE is not perfect. It is all on the money management the DD of my TE is because I am trying the indicator to its limits.
Frequently Asked Questions:
- Why do we plot on each timeframes? - Well we do it to see the bigger picture where the market is going. This will give us the info, to focus our bias.
- Can we enter the market or base our analysis on any timeframes? - Yes of course! Lower timeframes will give you the opportunity to do scalping while higher timeframes give you the opportunity to swing.
- Why do we consider the last two periods on D1, H4, and H1? - So we can determine where the market was going on the last few days.
- Why one period only and swing on the lower time frames? - Because it can be easily be broken and you need to update it and plot again. While W1, needs a lot of time or 1 month for the next period that's why we need to plot it only in the current period.
Indicator - Updated 10/05/2019
Attached File(s)
Changes: Improved and updated calculation. Mobile notifications added and can now be used in any pairs.
Notes: As you noticed there is nothing to configure like indicators because the calculation and plotting are done in the background.
ALL ABOUT EXPERT ADVISER
IMPORTANT
NOTE: RIGHT CLICK AND COPY LINK
- To enable news filter add this: " http://ec.forexprostools.com/?column...Zone=15&lang=1 ".
Go to MetaTrade 4 > Options > Expert Adviser Tab > Check Allow Web Request > then add the link above. > Click OK.
PRESETS ARE AVAILABLE FOR DOWNLOAD.
Attached File(s)
Attached File(s)
Preferred Broker: IC Market RAW ECN - I like this broker because of the low spread and commissions.
NOTES: FULL VERSION IS AVAILABLE NOW! UNLOCKS ALL PAIRS AND CAN BE USED WITH UNLIMITED ACCOUNTS.
EMAIL IS THE KEY: [email protected]
Attached Image (click to enlarge)
Eeh?
EA - Osoi Kame V7 All Time Profit:
$2,340