hi, i'm glad to share my tools & indicators for free in this thread.
RULES:
1) Before ask about your problem, make sure you are using latest version of that indicator or script by checking the first post of this thread.
2) When presenting your problem, provide enough information along with the screenshots of chart and Terminal/Experts tab.
3) Don't ask about miscellaneous indicators/scripts/EAs modification or improvement that doesn't belong to this thread.
TUX_Trend_Indicator
TTI is a dashboard that shows market trend conditions in 5 state based on combination of three indicators. (Additional Information)
Version History:
⇒ v1.0_beta1 ---- 05/19/2020
- initial release
⇒ v1.0_beta2 ---- 05/25/2020
- Added "Pullback" feature based an idea that explained here.
⇒ v1.0_beta3 ---- 05/29/2020
- Important bug fixed in "MA Angle" function that sometimes caused to show wrong result in some timeframes.
- Changed default value of "AngleLevel" to 1.9 and "AngleBars" to 11
- Code optimization & speed improvement
⇒ v1.0_beta4 ---- 06/01/2020
- A minor bug that caused to slowdown have been fixed.
⇒ v1.0_beta5 ---- 06/12/2020
- Code optimization & speed improvement
⇒ v1.0 ---- 06/29/2020
- Minor code optimization
- Removed Expiration Date
⇒ v1.1 ---- 08/09/2020
- Huge speed improvement
- Code cleanup
Attachment 4
TUX_AutoFibo
This indicator draws automatically Fibonacci Retracement between order open price and nearest swing high/low to show StopLoss and TakeProfit levels. when you have an open position on chart, it draws automatically Entry/SL/TP levels.
Version History:
⇒ v1.0 ---- 05/16/2020
- initial release
⇒ v1.1 ---- 06/05/2020
- Code optimization & speed improvement
⇒ v1.2 ---- 06/08/2020
- Minor bug fixed
Download Latest Version: #Post 188
TUX_StopPending_Script
It's a script to place Buy Stop/Sell Stop pending order with SL/TP on candle's high/low. there is different options for StopLoss/TakeProfit to use.
Version History:
⇒ v1.0 ---- 04/16/2020
- initial release
⇒ v2.0 ---- 04/24/2020
- Added option to set pending order on highest/lowest of several candles
Download Latest Version:
Attachment 4
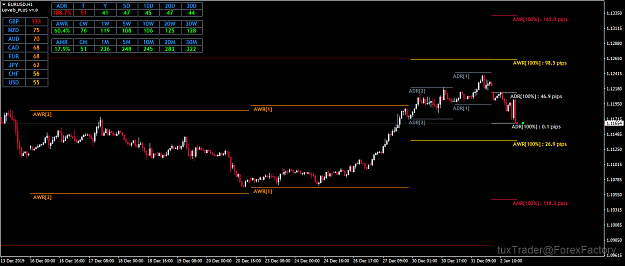
Levels_PLUS
Levels_PLUS is new version and successor of ADR_PLUS with more features and functionality. This indicator has all features of ADR_PLUS plus new features like Average Weekly Range (AWR) and Average Monthly Range (AMR) with full functionality same as Average Daily Range. Also the new OHLC function can draws Open/High/Low/Close Levels for current and history of 1 Hour, 4 Hour, Daily, Weekly and Monthly timeframes. And finally many optimization have been done on Levels_PLUS indicator.
Version History:
⇒ v1.0 ---- 01/03/2020
- initial release
⇒ v1.1 ---- 02/02/2020
- Added support for H1 & H4 timeframe in OHLC
- Now you can set separate "Number of Period" for each level of OHLC
- Minor Changes in settings of OHLC for easier configuration
- Minor Optimization
⇒ v2.0 ---- 06/19/2020
- OHLC function improvement:
Download Latest Version:
Attachment 4
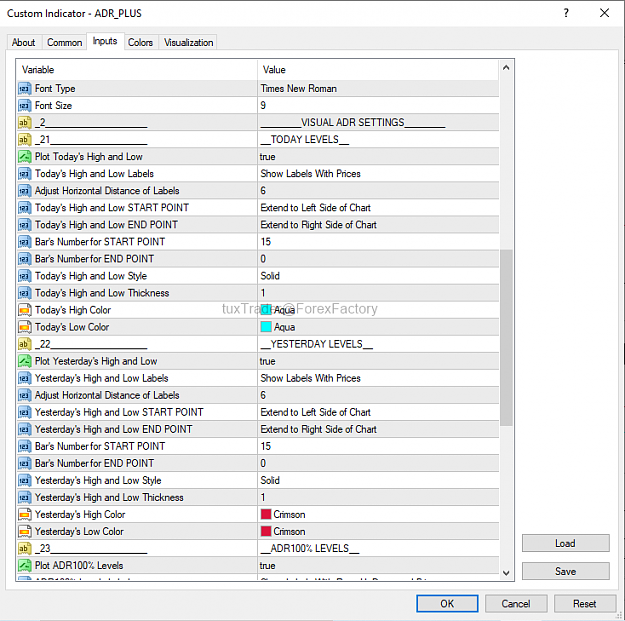
ADR_PLUS END OF DEVELOPEMENT
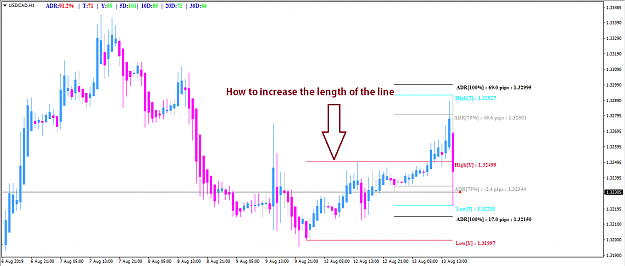
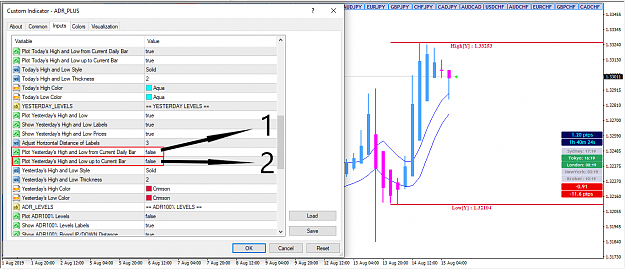
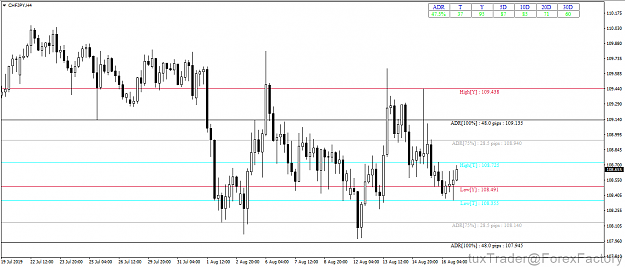
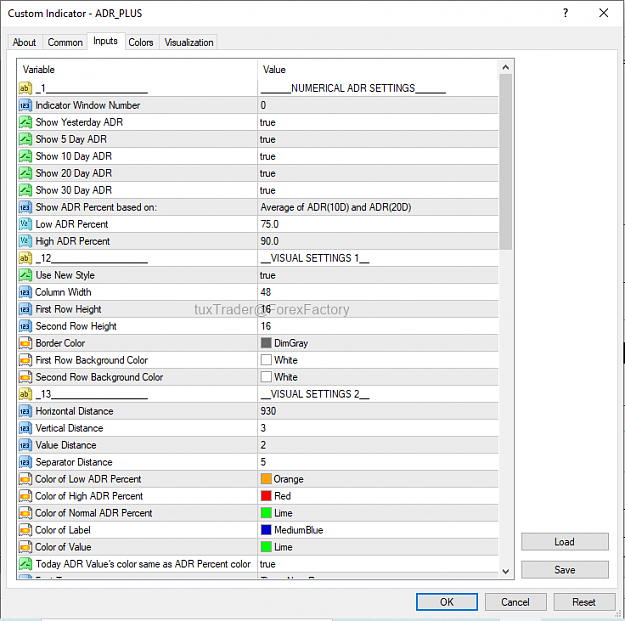
This indicator displays the Average Daily Range for Today, Yesterday, 5 Day, 10 Day, 20 Day, 30 Day and any custom periods in two ways of numerical and visually on chart. in visually section, it plots high & low Levels of today, yesterday and the days before that, Dynamic ADR Levels (100% and/or custom percent) of today, yesterday and the days before that with RoomUP/DOWN options that show momentary distance of current price to ADR Levels in pips.
Version History:
⇒ v1.0 ---- 08/10/2019
- initial release
⇒ v2.0 ---- 08/13/2019
- added options to Plot Today's High and Low
- added options to Plot Yesterday's High and Low
- added options to Plot ADR100% Levels
- added options to Plot Custom ADR percent Levels
- added RoomUP/DOWN options that show momentary distance of current price to ADR Levels in pips
⇒ v2.1 ---- 08/15/2019
- code optimization
⇒ v3.0 ---- 08/19/2019
- Redesigned Settings for more user-friendly and functionality
- New Style for showing Numerical ADR Periods (old style is still available)
- New Options of Plotting Lines and Labels for all Levels
⇒ v3.1 ---- 08/21/2019
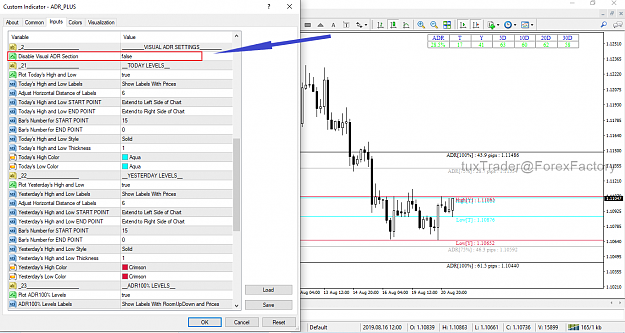
- Added "Disable Visual ADR Section" Option to hide all levels lines
- Fixed Bug (appeared in previous version) that led to show wrong RoomUP/Down values
⇒ v4.0 ---- 10/27/2019
- ADR_PLUS v4.0 is completely rewritten for more user friendly, usability, performance and accuracy.
- you can add as many as custom and arbitrary ADR Periods in Numerical ADR Settings.
- you can plot High and Low History and ADR History Lines for any number of days.
- finally we have ADR Alert section. it alerts you if price crosses ADR 100% and/or ADR Custom% Levels.
⇒ v5.0 ---- 12/03/2019
- We have a new major part called Currency Average ADR based on idea by mrdfx explained here.
- Improvements and Optimization on Alert Functionality.
- new version of ADR_PLUS_Indicator_Guidance file.
⇒ v5.1 ---- 12/04/2019
- Minor bugs fixed and Code Optimization
⇒ v5.2 ---- 12/06/2019
- Important bug fixed in "Currency Average ADR" function that led to show wrong results for some users(brokers). Highly Recommended to upgrade to this Version.
- "Currency Average ADR" function optimized for more accuracy and performance.
- Added a new option that shows a "Detailed Report" of Currency Average ADR Calculation Process in mt4 terminal (Experts tab).
- Added a new option in SYMBOL NUMERICAL ADR SETTINGS to shows ADR numbers of different periods as Rounded or Decimal Numbers.
- New drop down menu option for "Today ADR Value's Color" in SYMBOL NUMERICAL ADR SETTINGS.
⇒ v6.0 ---- 12/10/2019
- Added full featured "OPEN/CLOSE LEVELS" that you can draw open and close lines of monthly, weekly and daily timeframe on charts via this new part of ADR_PLUS.
- Code Optimization
⇒ v6.1 ---- 12/12/2019
- Changes & Improvement on Label's text of Open/Close Levels
- Optimization on Drawing of ADR Levels
Download Latest Version:
Attachment 4
Help File:
Attachment f
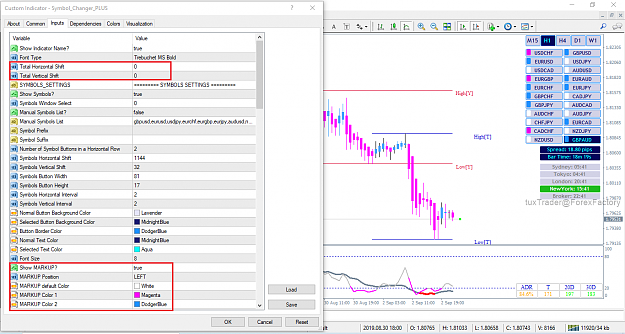
Symbol_Changer_PLUS
It's a fully customizable utility for changing symbol pairs and timeframes on one chart. it also shows other useful information such as Spread, Time remaining to close bar, Loss/Profit as pips and deposit currency, Market hours and ATR.
Version History:
⇒ v1.0 ---- 08/14/2019
- initial release
⇒ v2.0 ---- 09/03/2019
- a new feature called MARKUP (description here)
- Added "Total Horizontal Shift" and "Total Vertical Shift" options to move all parts at once.
- code optimization
⇒ v3.0 ---- 10/04/2019
- ATR (Average True Range) indicator Implemented as one of the main parts of Symbol Changer Plus (description here)
- new MARKUP options to show marking buttons only on pairs with/without open order
⇒ v3.1 ---- 10/07/2019
- minor bug fixed
⇒ v3.2 ---- 10/15/2019
- minor bugs fixed and code optimization
⇒ v3.3 ---- 11/14/2019
- Added Excluded Currencies input list. All pairs that contains currencies in this list will be removed from symbol buttons.
- code optimization
⇒ v4.0 ---- 02/25/2020
- Added "Corner" option for ALL PARTS of indicator for better configuration and positioning of objects on chart.
- "Excluded Currencies" in "SYMBOL SETTINGS" replaced by new "Excluded List" option. now you can add any number of currency and symbol pair without limitation to filter out in symbol buttons. please note that this option works only when "Manual Symbol Lists" is set on false.
- "Total Profit" now works independent of Symbol Buttons so you can have it on chart when "Show Symbols" is set on false.
- "Show Profit on Symbol Button" option moved to "SYMBOL SETTINGS" with separate background and border colors options.
- Added new option to "BAR CLOSE TIME SETTINGS". now you can have remaining close time of custom timeframe candles on current chart.
- code optimization
⇒ v4.1 ---- 03/03/2020
- Now you can have two ATR value based on two different multiplier. it's useful when you use ATR for both stop loss and take profit.
⇒ v5.0 ---- 06/26/2020
- New option called "Abbreviated SYMBOL NAME" in "SYMBOL SETTINGS"
- Code Optimization
Download Latest Version:
Attachment 4
RULES:
1) Before ask about your problem, make sure you are using latest version of that indicator or script by checking the first post of this thread.
2) When presenting your problem, provide enough information along with the screenshots of chart and Terminal/Experts tab.
3) Don't ask about miscellaneous indicators/scripts/EAs modification or improvement that doesn't belong to this thread.
TUX_Trend_Indicator
TTI is a dashboard that shows market trend conditions in 5 state based on combination of three indicators. (Additional Information)
Version History:
⇒ v1.0_beta1 ---- 05/19/2020
- initial release
⇒ v1.0_beta2 ---- 05/25/2020
- Added "Pullback" feature based an idea that explained here.
⇒ v1.0_beta3 ---- 05/29/2020
- Important bug fixed in "MA Angle" function that sometimes caused to show wrong result in some timeframes.
- Changed default value of "AngleLevel" to 1.9 and "AngleBars" to 11
- Code optimization & speed improvement
⇒ v1.0_beta4 ---- 06/01/2020
- A minor bug that caused to slowdown have been fixed.
⇒ v1.0_beta5 ---- 06/12/2020
- Code optimization & speed improvement
⇒ v1.0 ---- 06/29/2020
- Minor code optimization
- Removed Expiration Date
⇒ v1.1 ---- 08/09/2020
- Huge speed improvement
- Code cleanup
Attachment 4
TUX_AutoFibo
This indicator draws automatically Fibonacci Retracement between order open price and nearest swing high/low to show StopLoss and TakeProfit levels. when you have an open position on chart, it draws automatically Entry/SL/TP levels.
Version History:
⇒ v1.0 ---- 05/16/2020
- initial release
⇒ v1.1 ---- 06/05/2020
- Code optimization & speed improvement
⇒ v1.2 ---- 06/08/2020
- Minor bug fixed
Download Latest Version: #Post 188
TUX_StopPending_Script
It's a script to place Buy Stop/Sell Stop pending order with SL/TP on candle's high/low. there is different options for StopLoss/TakeProfit to use.
Version History:
⇒ v1.0 ---- 04/16/2020
- initial release
⇒ v2.0 ---- 04/24/2020
- Added option to set pending order on highest/lowest of several candles
Download Latest Version:
Attachment 4
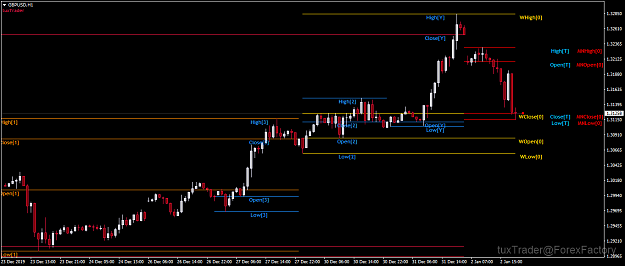
Levels_PLUS
Levels_PLUS is new version and successor of ADR_PLUS with more features and functionality. This indicator has all features of ADR_PLUS plus new features like Average Weekly Range (AWR) and Average Monthly Range (AMR) with full functionality same as Average Daily Range. Also the new OHLC function can draws Open/High/Low/Close Levels for current and history of 1 Hour, 4 Hour, Daily, Weekly and Monthly timeframes. And finally many optimization have been done on Levels_PLUS indicator.
Version History:
⇒ v1.0 ---- 01/03/2020
- initial release
⇒ v1.1 ---- 02/02/2020
- Added support for H1 & H4 timeframe in OHLC
- Now you can set separate "Number of Period" for each level of OHLC
- Minor Changes in settings of OHLC for easier configuration
- Minor Optimization
⇒ v2.0 ---- 06/19/2020
- OHLC function improvement:
• each level of OHLC section works completely independent
• simplified settings and more customization capability
• new "Interconnected Levels" option
- Separated input list for "Periods" and "A,B,C Values" of ADR/AWR/AMR in "NUMERICAL INFO" sectionAttached Image (click to enlarge)
Attached Image (click to enlarge)
Download Latest Version:
Attachment 4
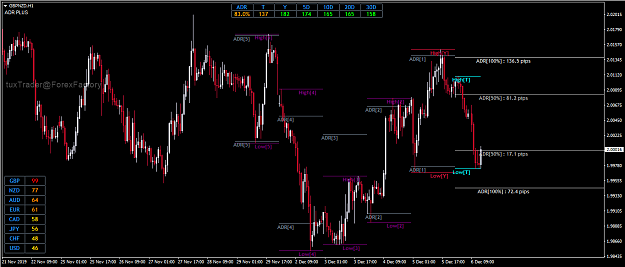
ADR_PLUS END OF DEVELOPEMENT
This indicator displays the Average Daily Range for Today, Yesterday, 5 Day, 10 Day, 20 Day, 30 Day and any custom periods in two ways of numerical and visually on chart. in visually section, it plots high & low Levels of today, yesterday and the days before that, Dynamic ADR Levels (100% and/or custom percent) of today, yesterday and the days before that with RoomUP/DOWN options that show momentary distance of current price to ADR Levels in pips.
Attached Image (click to enlarge)
Version History:
⇒ v1.0 ---- 08/10/2019
- initial release
⇒ v2.0 ---- 08/13/2019
- added options to Plot Today's High and Low
- added options to Plot Yesterday's High and Low
- added options to Plot ADR100% Levels
- added options to Plot Custom ADR percent Levels
- added RoomUP/DOWN options that show momentary distance of current price to ADR Levels in pips
⇒ v2.1 ---- 08/15/2019
- code optimization
⇒ v3.0 ---- 08/19/2019
- Redesigned Settings for more user-friendly and functionality
- New Style for showing Numerical ADR Periods (old style is still available)
- New Options of Plotting Lines and Labels for all Levels
⇒ v3.1 ---- 08/21/2019
- Added "Disable Visual ADR Section" Option to hide all levels lines
- Fixed Bug (appeared in previous version) that led to show wrong RoomUP/Down values
⇒ v4.0 ---- 10/27/2019
- ADR_PLUS v4.0 is completely rewritten for more user friendly, usability, performance and accuracy.
- you can add as many as custom and arbitrary ADR Periods in Numerical ADR Settings.
- you can plot High and Low History and ADR History Lines for any number of days.
- finally we have ADR Alert section. it alerts you if price crosses ADR 100% and/or ADR Custom% Levels.
⇒ v5.0 ---- 12/03/2019
- We have a new major part called Currency Average ADR based on idea by mrdfx explained here.
- Improvements and Optimization on Alert Functionality.
- new version of ADR_PLUS_Indicator_Guidance file.
⇒ v5.1 ---- 12/04/2019
- Minor bugs fixed and Code Optimization
⇒ v5.2 ---- 12/06/2019
- Important bug fixed in "Currency Average ADR" function that led to show wrong results for some users(brokers). Highly Recommended to upgrade to this Version.
- "Currency Average ADR" function optimized for more accuracy and performance.
- Added a new option that shows a "Detailed Report" of Currency Average ADR Calculation Process in mt4 terminal (Experts tab).
- Added a new option in SYMBOL NUMERICAL ADR SETTINGS to shows ADR numbers of different periods as Rounded or Decimal Numbers.
- New drop down menu option for "Today ADR Value's Color" in SYMBOL NUMERICAL ADR SETTINGS.
⇒ v6.0 ---- 12/10/2019
- Added full featured "OPEN/CLOSE LEVELS" that you can draw open and close lines of monthly, weekly and daily timeframe on charts via this new part of ADR_PLUS.
- Code Optimization
⇒ v6.1 ---- 12/12/2019
- Changes & Improvement on Label's text of Open/Close Levels
- Optimization on Drawing of ADR Levels
Download Latest Version:
Attachment 4
Help File:
Attachment f
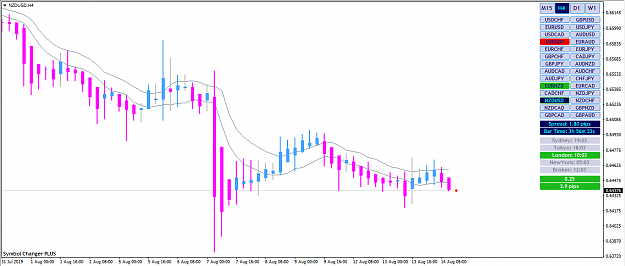
Symbol_Changer_PLUS
It's a fully customizable utility for changing symbol pairs and timeframes on one chart. it also shows other useful information such as Spread, Time remaining to close bar, Loss/Profit as pips and deposit currency, Market hours and ATR.
Attached Image (click to enlarge)
Version History:
⇒ v1.0 ---- 08/14/2019
- initial release
⇒ v2.0 ---- 09/03/2019
- a new feature called MARKUP (description here)
- Added "Total Horizontal Shift" and "Total Vertical Shift" options to move all parts at once.
- code optimization
⇒ v3.0 ---- 10/04/2019
- ATR (Average True Range) indicator Implemented as one of the main parts of Symbol Changer Plus (description here)
- new MARKUP options to show marking buttons only on pairs with/without open order
⇒ v3.1 ---- 10/07/2019
- minor bug fixed
⇒ v3.2 ---- 10/15/2019
- minor bugs fixed and code optimization
⇒ v3.3 ---- 11/14/2019
- Added Excluded Currencies input list. All pairs that contains currencies in this list will be removed from symbol buttons.
- code optimization
⇒ v4.0 ---- 02/25/2020
- Added "Corner" option for ALL PARTS of indicator for better configuration and positioning of objects on chart.
- "Excluded Currencies" in "SYMBOL SETTINGS" replaced by new "Excluded List" option. now you can add any number of currency and symbol pair without limitation to filter out in symbol buttons. please note that this option works only when "Manual Symbol Lists" is set on false.
- "Total Profit" now works independent of Symbol Buttons so you can have it on chart when "Show Symbols" is set on false.
- "Show Profit on Symbol Button" option moved to "SYMBOL SETTINGS" with separate background and border colors options.
- Added new option to "BAR CLOSE TIME SETTINGS". now you can have remaining close time of custom timeframe candles on current chart.
- code optimization
⇒ v4.1 ---- 03/03/2020
- Now you can have two ATR value based on two different multiplier. it's useful when you use ATR for both stop loss and take profit.
⇒ v5.0 ---- 06/26/2020
- New option called "Abbreviated SYMBOL NAME" in "SYMBOL SETTINGS"
- Code Optimization
Download Latest Version:
Attachment 4