✜ v2v dynamic trading system ✜ ─ for the MT4 platform
A Project Lookin' Glass by v2v...
Introducing the v2v dynamic trading system, a groundbreaking solution tailored to the retail trading environment. At its core, the system is powered by the Dominant Cycle Period (DCP) and MomenTicks, an advanced, volume-weighted momentum algorithm.
The v2v dynamic trading system sets itself apart from conventional approaches by eschewing traditional elements such as directional arrows or trigger alerts for buy/sell signals. Instead, it fosters a more analytical and strategic mindset, challenging users to engage in critical thinking when navigating the complexities of the market. This unique design empowers traders, like yourself, to make informed decisions and capitalize on emerging opportunities.
As an evolving and continually updated system, the v2v dynamic trading platform does not come with a traditional user manual. Users are encouraged to exercise due diligence and proactively explore its features to fully understand and harness its capabilities.
To embark on this journey, it is essential to embrace a fresh perspective that acknowledges the intricate landscape of modern trading. By cultivating a strong belief in your potential and resilience, you can confidently navigate the market and challenge traditional limitations.
And now...
“Take a deep breath, relax, and start believing we are living in the Matrix, where the Market (Makers) can't kill you, but the Market thinks they can. Then... As you walk with the Architect from beyond (who holds the Akashic records), you'll begin to observe what is happening while a newly developed neural pathway to the art (or science) of trading is designed for you. With the guidance of powerful tools offered by this system, you will uncover new insights and develop your own unique approach to trading. Complemented by a well-crafted strategy, effective risk management techniques, and a trustworthy broker, you will pave the way towards sustained profitability and success as you gain invaluable experience.” ─ Agent v2v
That said, be sure to...
The v2v dynamic trading system is tailored to suit the needs of discretionary traders who utilize a systematic trading plan or strategy. By employing this system, users may find it beneficial in managing their trades or adjusting current positions, thereby optimizing their overall trading performance. Moreover, this system can aid in identifying potential opportunities and determining an average or overall directional probability, leading to more informed decision-making.
Please bear in mind that the v2v dynamic trading system is a work in progress, and there is always scope for further refinement and improvement. Your valuable ideas and suggestions are appreciated, and while they may not necessarily be incorporated, they will certainly be taken into consideration as we continue to develop and enhance the system.
Now while trying to identify what is real and what isn't, it may seem like you have entered the Matrix already. But... in any case, it all depends on what pill you took from Morpheus (red or blue).
Meanwhile, you may feel as if you have been resurrected. Please do not worry, you will be fine. At other times, you might see a Black Cat just walk by and then be followed by another that behaves similarly as you wonder... Is it deja vu? Again, don't worry, it simply means that I'm currently altering the codes of the v2v dynamic trading system.
The definition of technologies used inside this system...
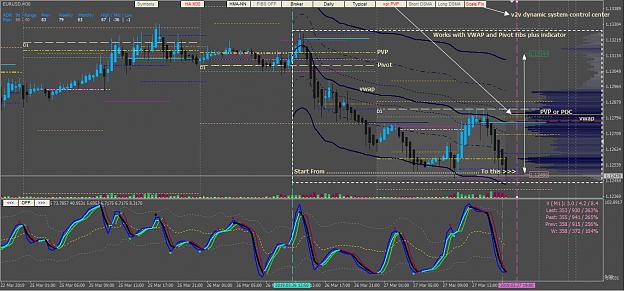
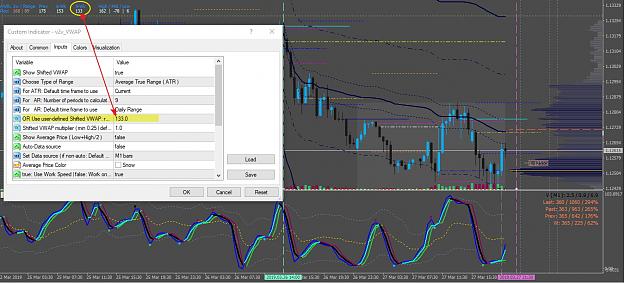
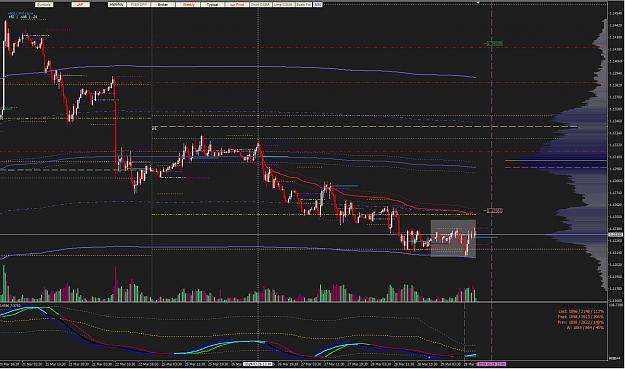
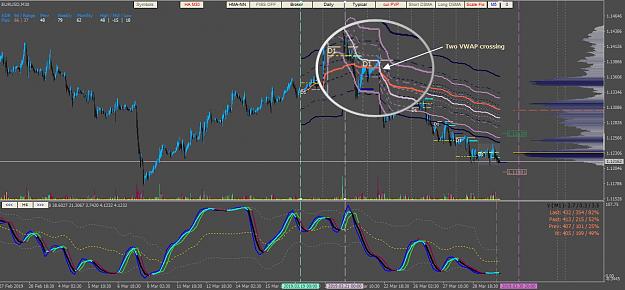
☛ The VWAP bands on this system
Using an average true range/average range or an average daily range, the VWAP bands (shifted from the main line) are calculated with statistical z-scores. The VWAP calculation is primarily based on the lecture by Dr. Paul Levine (R.I.P.) on the MIDAS system.
A statistical z-score value can be injected into an algorithm or included in an equation for predicting trend-end probabilities. The vertical line guides on-chart (from & to) is used for plotting price inflection points or session ranges (4-hour, daily, weekly, and monthly or 8-hour or 24-hour market range). The setup included a feature that can switch from MVWAP (MA-based VWAP ) to classic VWAP. MA (Moving Average) is a non-lag Hull MA calculated using Fulk's Matulich for T3-based MA. As a result, I call it T3-HMA.
As part of the system, linear, volume-weighted MAs are applied (but only some of them, as the rest use adaptive calculations with Price) before adding the DSMA filter (Deviation-Scaled MAs by John F. Ehlers). Then, the MA's period calculation within the system is calculated/assigned dynamically based on the current Dominant Cycle Period.
☛ Dynamic Zones by Leo Zamansky Ph.D. and David Stendahl
The Dynamic Zone indicator elaborately shows how it solves common trading complications. An oscillator is a valuable technical analysis tool employed in aggressive investment strategies to capitalize on market trends. This approach to investing adheres to a straightforward, logic-based methodology - It only enters the market when an oscillator has moved far above or below traditional trading levels. However, these indicator-driven systems cannot evolve with the market because they use fixed buy and sell zones. Traders typically use one set of buy and sell zones for a bull market and substantially different zones for a bear market.
Herein lie the complications. Once traders begin introducing their market opinions into trading equations, they negate the system's mechanical nature by changing the zones. The objective is to have a system automatically define its buy and sell zones and thereby profitably trade in any market -- bull or bear. Dynamic Zones present a dynamic solution to the limitations of fixed buy and sell zones in any indicator-driven system.
☛ Jurik filter ─ phase and smoothing
JMA (Jurik Research Moving Average) phase and smoothing calculation. Have you noticed how moving averages add some lag (delay) to your signals? ... especially when price gaps are up or down in a substantial move, and you are waiting for your moving average to catch up? Wait no more! JMA eliminates these complications forever and gives you the benefits of both worlds: low lag and smooth lines.
Ideally, for instance, a filtered signal should be smooth and lag-free. Lag causes delays in your trades, and increasing lag in your indicators typically results in lower profits. In other words, latecomers get what's left on the table after the feast has already begun. The JMA's improved timing and smoothness will astound you.
JMA is a powerful adaptive tracker that can smooth time series data with minimal lag, no overshoots, and no oscillations. The algorithm is stable and avoids the complexities of neural networks. JMA delivers the most reliable all-around performance for smoothness, accuracy, and timeliness.
☛ Best Formula: Using Average Price Bar ( APB )
Average Price Bars provide a better depiction of the current market by eliminating or reducing fluctuations in nominal price action often referred to as “choppiness” of current High, Low, and Close price action. In other words, APB removes the noise of price distortion.
☛ haDelta (Heiken Ashi - Delta)
haDelta is a simple formula originally developed and published by Mr. Dan Valcu. The idea behind haDelta is to quantify HA candles. One can measure momentum, which is very important when you use haDelta for reversals. It measures the difference between haClose and haOpen. Caution: High sensitivity if used.
☛ Uses Hull MA (by Allan Hull) but this one is a variation from Low lag to zero lag
Various types of moving averages exist, with the Simple Moving Average (SMA) being the most basic. However, the SMA suffers from significant lag in relation to price movements. To address this issue, the Exponential and Weighted Moving Averages were introduced, which focus more on recent data for better accuracy. Allan Hull developed the Hull Moving Average (HMA), a remarkably fast and smooth method that virtually removes lag while simultaneously enhancing smoothing. The dynamic MyRSI with NET, combined with T3 Hull MA variation, Jurik filters, and phase & smoothing, ultimately achieves optimal lag elimination for more precise results.
☛ Ehler's Deviation-Scaled Moving Average ( DSMA )
The Deviation-Scaled Moving Average (DSMA) is an innovative data smoothing technique introduced by John Ehlers in the July 2018 issue of TASC magazine. The DSMA functions as an exponential moving average with a dynamic smoothing coefficient, which adapts based on the magnitude of price changes. By utilizing the standard deviation from the mean to measure this magnitude, the DSMA provides substantial data smoothing, even when price changes are small, while swiftly adapting to these changes. As a result, this indicator offers minimal computational lag and rapid adaptation to price variations, making it an effective tool for identifying trends and potential trading opportunities.
☛ Vertical Horizontal Filter ( VHF )
The Vertical Horizontal Filter (VHF), developed by Adam White, serves as a valuable tool for identifying trending and ranging markets. Much like the ADX in the Directional Movement System, the VHF assesses the degree of trend activity, enabling traders to apply trend indicators in trending markets and momentum indicators in ranging markets. By effectively distinguishing between these market conditions, the Vertical Horizontal Filter allows for more accurate and informed decision-making when employing various trading strategies.
☛ Dominant Cycle Period ( DCP )
The DCP-generated value is being used as a dynamic Period parameter value (for dynamic MyNET).
Based on Homodyne Discriminator by John F. Ehlers, Rocket Science for Traders. This type of algorithm exhibits superior performance in a low signal-to-noise environment.
☛ Linear Momentum ─ a.k.a. MomenTicks
Linear momentum is defined as the product of a system's mass multiplied by its velocity. In symbols, linear momentum is expressed as p = mv. Momentum is directly proportional to the object's mass and also its velocity. Thus the greater an object's mass or the greater its velocity, the greater its momentum.
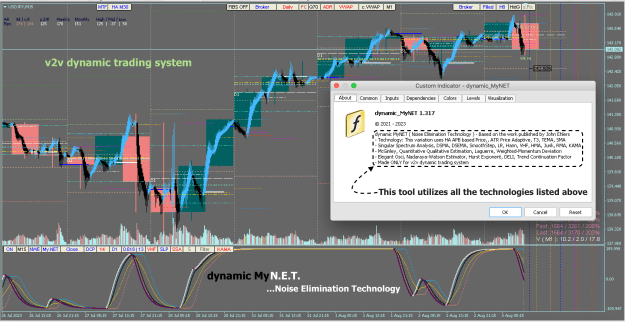
☛ My NET ( Noise Elimination Technology )
As a technical indicator, My NET employs Kendall correlation to eliminate nonlinear noise. However, the application of additional filters in this system results in a significantly less noisy plot than RSI.
The NET is a modified version of the RocketRSI Relative Strength Index. A one-bar close price difference is calculated as the ratio between their absolute values and the sum of the recent one-bar close price differences.
☛ Elegant Osci
In a unique update for dynamic MyNET with SmoothStep function, "An Elegant Oscillator: Inverse Fisher Transform Redux," author John Ehlers (At TASC Magazine article - February 2022) explains how he uses the inverse Fisher transform to create an indicator he calls the elegant oscillator.
First, he describes the Fisher transform before explaining the inverse Fisher transform, which provides normalization by dividing the root mean square (RMS) value into the waveform.
The elegant oscillator can spot reversion-to-the-mean opportunities with improved timing capabilities.
☛ Momentum Deviation
This is another variation of a standard deviation as it got embedded with dynamic MyNET
- it uses the momentum of price (instead of price itself) for calculation
- it is calculated in a way that it takes minimal CPU load
- As far as values are concerned, it is similar to standard deviation. Same as standard deviation -it can calculate the deviation of anything.
☛ The ADX
ADX is a very popular indicator and its elaborated form is the Average Directional Movement. Traders rely on this indicator to assess the strength of the trend. However, using the traditional ADX requires a perfect understanding of the highs and lows of the market. To make things easier, the developers have created the ADXm Indicator.
dynamic MyNET uses the ADXm algorithm.
☛ The Linear Regression-adjusted Quantitative Qualitative Estimation double
TASC magazine's August 2022 issue, featured another variant of a moving average called “The Linear Regression-Adjusted Exponential Moving Average." Author Vitali Apirine presents a technique called the linear regression-adjusted exponential moving average (LRAdj EMA) to combine a linear regression indicator with an EMA. The indicator can be used to help define turning points while filtering price movement. The LRAdj EMA can be applied in combination with a traditional exponential moving average of the same length to facilitate trend identification.
☛ Hurst Exponent with NET (a variation) - inside dynamic MyNET
In the 1970’s an American engineer called JM Hurst published a theory about why financial markets move in the way they do. The theory was the result of many years of research on powerful mainframe computers, and it became known as Hurst’s Cyclic Theory. Hurst claimed a 90% success rate trading based on his theory, and yet the theory has remained largely undiscovered and often misunderstood.
The Hurst Exponent is used as a measure of long-term memory of time series. It relates to the autocorrelations of the time series, and the rate at which these decrease as the lag between pairs of values increases. Studies involving the Hurst exponent were originally developed in hydrology for the practical matter of determining optimum dam sizing for the Nile River's volatile rain and drought conditions that had been observed over a long period. The name "Hurst exponent", or "Hurst coefficient", derives from Harold Edwin Hurst (1880 - 1978), who was the lead researcher in these studies; the use of the standard notation H for the coefficient relates to his name also.
The Hurst exponent is referred to as the "index of dependence" or "index of long-range dependence". It quantifies the relative tendency of a time series either to regress strongly to the mean or to cluster in a direction.
A value of H in the range 0.5 - 1 indicates a time series with long-term positive autocorrelation, meaning both that a high value in the series will probably be followed by another high value and that the values a long time into the future will also tend to be high.
A value of H in the range 0 - 0.5 indicates a time series with long-term switching between high and low values in adjacent pairs, meaning that a single high value will probably be followed by a low value and that the value after that will tend to be high, with this tendency to switch between high and low values lasting a long time into the future.
A value of H = 0.5 can indicate a completely uncorrelated series, but it is the value applicable to series for which the autocorrelations at small time lags can be positive or negative but where the absolute values of the autocorrelations decay exponentially quickly to zero. This is in contrast to the typical power-law decay for the 0.5 < H < 1 and 0 < H < 0.5 cases.
Hurst exponent estimation is a viable tool for analyzing the past. Looking at a correctly estimated H value can answer the following question: was the market persistent or was it anti-persistent? In turn, that would help you analyze the performance of your trading strategy or expert advisor during that particular period.
YouTube video about Hurst Trading
Note to Self: “While no methodology or system that works in every instance . . . I have never seen anything so consistent” ─ just like this system ; )─
No guarantees are provided as to the accuracy, completeness, timeliness, suitability, or accuracy of any information - such as indicators, videos, images, and charts - posted or shared here. The contents I posted here at ForexFactory (FF) are subject to modification (bound by FF and thread owner's rules and restrictions) and may have become unreliable due to a variety of factors, including changes in market conditions or economic factors.
It is important to acknowledge that trading inherently carries a degree of risk, and individual outcomes may differ. Past performance and personal experiences should not be considered indicative of future results. To assess the suitability of any investment strategy, product, or service discussed here, it is advisable to consult with a qualified investment professional who can evaluate your unique circumstances. Please note that all investments carry risks, including the potential loss of principal.
The primary intention behind sharing this information is not to gain a following or subscribers but rather to contribute to the broader trading community and maintain an online record of this system's development. Additionally, I would like to clarify that I do not have ADHD ; )─
Please read the below information before loading the v2v dynamic trading system (templates) on your chart.
Each currency pair or instrument must follow the following steps to load enough tick/volume history. Thus, these are required for the system to function properly... especially if this is your first time logging in to your (new) live/demo account.
Step 1) Open an M1 chart
Step 2) Press the "F2" key to load the History Center
Step 3) Navigate to the currency pair and the "1 Minute (M1)" history data for the chart you have open in your terminal (be sure to "double click" the "1 Minute (M1)" selection in the history center so it becomes the active selection)
Step 4) Then left-click once on any of the data rows in the right-hand window of the History Center (it doesn't matter which one)
Step 5) Click the "Add" button, this pops up another window titled "Bar" and the default selection is on the "year"
Step 6) Enter 1970
Step 7) Then select "OK"... and it creates a new bar with the timestamp and price info you just added.
Step 8) Now select "Close" in the History Center
Step 9) Navigate to your M1 chart of interest and then from the terminal window (press Ctrl-T) select "Journal "-> go to the main chart window and right-click the mouse button and select "Refresh"...this will refresh the chart and attempt to fill any time gaps in the chart data (which now includes your year 1970 data point) with server data
...continued...
The chart will now have pulled anywhere between 2048 and 65536 M1 bars from your broker's server (not Metaquotes), which is usually more data than you can manually scroll back in time when you manually scroll your M1 chart.
If everything went smoothly... then you've quickly downloaded all the broker's M1 data on your currency pair that the broker can let you have. This is much faster than holding down the home or page-up key for minutes and minutes to get even less data. Now, you may continue with the rest of the timeframes. Once more history is downloaded, be sure to delete any 1970 dummy tick data. Next, you may need to verify that after the deletion (1970 record) the maximum historical data has been obtained, otherwise add the 1970 record again.
Note (for first-time users): The v2v dynamic system must grow with the MT4 platform as it requires a broad tick data history.
Once the platform gathers enough data, the system will no longer display an error message (viewed via Expert logs). Such as... "not enough tick data to calculate", "data horizon breach", and "array out of range".
It is important to emphasize that the v2v dynamic trading system is designed for experienced users and may not be suitable for beginners. A strong understanding of its workings is crucial to successfully utilize this system. If you find the system too complex, it would be best to explore other options that better align with your current skill level.
Effectively utilizing the v2v dynamic trading system requires due diligence, resourcefulness, and familiarity with third-party tools and indicators. With sufficient trading experience, users can better determine if the system suits their needs without resorting to negative criticism towards its creator. Remember, this system is offered free of charge, and the effort invested in its development should be appreciated.
The information provided in this system development thread journal offers a comprehensive starting point for those who wish to explore the v2v dynamic trading system. In addition to these resources, traders must also cultivate essential qualities such as patience, composure, resolve, self-discipline, and resilience, as well as the ability to make counter-intuitive decisions when necessary.
Anyway... Good luck and trade well.
✜ v2v dynamic trading system ✜
You can consider trying this v2v dynamic trading system only if your current setup is not profitable. Otherwise, it's best to move on.
The current release of the v2v dynamic trading system:
New chart templates:
• Once loaded, check/verify the indicator parameter if you prefer a recursive calculation is ON or OFF.
• PIVOT FIBS plus and Custom Candle Any-TF use a hard-coded GMT+3 broker time (Metatrader 4 platform server time).
• To keep track of market session times, you can refer to either market24hclock.com or herein at ForexFactory.
Operational setup:
In case you encounter challenges while switching between system options or adjusting your chart screen and setup, it is advisable to temporarily disable certain features, such as the dynamic MyNET or Hidden Gap finder (turn OFF). Reducing the start bar parameter value can also be helpful. Doing so will enable smoother and more efficient navigation when making adjustments, setting stop-loss and take-profit levels, or closing existing positions. Once these tasks are completed, you can reactivate the features (turn back to ON) as needed to resume utilizing the system's full capabilities.
The one below is just a Custom Candle → Any Time Frame (CC - ATF) tool on its own... With the WRB plus Hidden Gap (WRB + HG).
- Detects Hidden Gaps in Wide Range Bars or Bodies.
- The WRB and HG definitions are taken from the WRB Analysis Tutorial-1 by M.A. Perry from TheStrategyLab.com.
The below screenshot is the updated Look & Feel
The expert reviews...
❝ His chart... You can tell it's real because it looks so fake, honestly ❞ ; )─ Elon Musk
❝ The Swiss Army Knife for the MT4 trading platform ❞ ; )─ Chat GPT
The v2v dynamic trading system is a comprehensive suite of tools and indicators that function synergistically; thus, they should not be employed in isolation. Relying on only one or two tools may lead to inaccurate results and suboptimal trading outcomes.
This system aims to cultivate a more responsible trading approach by empowering users to harness their analytical skills more efficiently. By identifying confluences and setups, the v2v dynamic trading system offers a technical baseline bias even before price action emerges on the chart. To maximize the system's potential, users must adapt and customize its components according to their specific needs and preferences.
Members who can post in this system development thread are...
A Project Lookin' Glass by v2v...
Introducing the v2v dynamic trading system, a groundbreaking solution tailored to the retail trading environment. At its core, the system is powered by the Dominant Cycle Period (DCP) and MomenTicks, an advanced, volume-weighted momentum algorithm.
The v2v dynamic trading system sets itself apart from conventional approaches by eschewing traditional elements such as directional arrows or trigger alerts for buy/sell signals. Instead, it fosters a more analytical and strategic mindset, challenging users to engage in critical thinking when navigating the complexities of the market. This unique design empowers traders, like yourself, to make informed decisions and capitalize on emerging opportunities.
To directly download the full system... Click ► HERE or continue reading below to learn more about this system.
As an evolving and continually updated system, the v2v dynamic trading platform does not come with a traditional user manual. Users are encouraged to exercise due diligence and proactively explore its features to fully understand and harness its capabilities.
To embark on this journey, it is essential to embrace a fresh perspective that acknowledges the intricate landscape of modern trading. By cultivating a strong belief in your potential and resilience, you can confidently navigate the market and challenge traditional limitations.
And now...
“Take a deep breath, relax, and start believing we are living in the Matrix, where the Market (Makers) can't kill you, but the Market thinks they can. Then... As you walk with the Architect from beyond (who holds the Akashic records), you'll begin to observe what is happening while a newly developed neural pathway to the art (or science) of trading is designed for you. With the guidance of powerful tools offered by this system, you will uncover new insights and develop your own unique approach to trading. Complemented by a well-crafted strategy, effective risk management techniques, and a trustworthy broker, you will pave the way towards sustained profitability and success as you gain invaluable experience.” ─ Agent v2v
That said, be sure to...
QuoteDislikedTrust in the Lord with all of your heart and lean not on your understanding; in all your ways submit to him, and he will make your paths straight
─Proverbs 3:5-6 NIV
The v2v dynamic trading system is tailored to suit the needs of discretionary traders who utilize a systematic trading plan or strategy. By employing this system, users may find it beneficial in managing their trades or adjusting current positions, thereby optimizing their overall trading performance. Moreover, this system can aid in identifying potential opportunities and determining an average or overall directional probability, leading to more informed decision-making.
Please bear in mind that the v2v dynamic trading system is a work in progress, and there is always scope for further refinement and improvement. Your valuable ideas and suggestions are appreciated, and while they may not necessarily be incorporated, they will certainly be taken into consideration as we continue to develop and enhance the system.
Now while trying to identify what is real and what isn't, it may seem like you have entered the Matrix already. But... in any case, it all depends on what pill you took from Morpheus (red or blue).
Meanwhile, you may feel as if you have been resurrected. Please do not worry, you will be fine. At other times, you might see a Black Cat just walk by and then be followed by another that behaves similarly as you wonder... Is it deja vu? Again, don't worry, it simply means that I'm currently altering the codes of the v2v dynamic trading system.
The definition of technologies used inside this system...
☛ The VWAP bands on this system
Using an average true range/average range or an average daily range, the VWAP bands (shifted from the main line) are calculated with statistical z-scores. The VWAP calculation is primarily based on the lecture by Dr. Paul Levine (R.I.P.) on the MIDAS system.
A statistical z-score value can be injected into an algorithm or included in an equation for predicting trend-end probabilities. The vertical line guides on-chart (from & to) is used for plotting price inflection points or session ranges (4-hour, daily, weekly, and monthly or 8-hour or 24-hour market range). The setup included a feature that can switch from MVWAP (MA-based VWAP ) to classic VWAP. MA (Moving Average) is a non-lag Hull MA calculated using Fulk's Matulich for T3-based MA. As a result, I call it T3-HMA.
As part of the system, linear, volume-weighted MAs are applied (but only some of them, as the rest use adaptive calculations with Price) before adding the DSMA filter (Deviation-Scaled MAs by John F. Ehlers). Then, the MA's period calculation within the system is calculated/assigned dynamically based on the current Dominant Cycle Period.
☛ Dynamic Zones by Leo Zamansky Ph.D. and David Stendahl
The Dynamic Zone indicator elaborately shows how it solves common trading complications. An oscillator is a valuable technical analysis tool employed in aggressive investment strategies to capitalize on market trends. This approach to investing adheres to a straightforward, logic-based methodology - It only enters the market when an oscillator has moved far above or below traditional trading levels. However, these indicator-driven systems cannot evolve with the market because they use fixed buy and sell zones. Traders typically use one set of buy and sell zones for a bull market and substantially different zones for a bear market.
Herein lie the complications. Once traders begin introducing their market opinions into trading equations, they negate the system's mechanical nature by changing the zones. The objective is to have a system automatically define its buy and sell zones and thereby profitably trade in any market -- bull or bear. Dynamic Zones present a dynamic solution to the limitations of fixed buy and sell zones in any indicator-driven system.
☛ Jurik filter ─ phase and smoothing
JMA (Jurik Research Moving Average) phase and smoothing calculation. Have you noticed how moving averages add some lag (delay) to your signals? ... especially when price gaps are up or down in a substantial move, and you are waiting for your moving average to catch up? Wait no more! JMA eliminates these complications forever and gives you the benefits of both worlds: low lag and smooth lines.
Ideally, for instance, a filtered signal should be smooth and lag-free. Lag causes delays in your trades, and increasing lag in your indicators typically results in lower profits. In other words, latecomers get what's left on the table after the feast has already begun. The JMA's improved timing and smoothness will astound you.
JMA is a powerful adaptive tracker that can smooth time series data with minimal lag, no overshoots, and no oscillations. The algorithm is stable and avoids the complexities of neural networks. JMA delivers the most reliable all-around performance for smoothness, accuracy, and timeliness.
☛ Best Formula: Using Average Price Bar ( APB )
Average Price Bars provide a better depiction of the current market by eliminating or reducing fluctuations in nominal price action often referred to as “choppiness” of current High, Low, and Close price action. In other words, APB removes the noise of price distortion.
☛ haDelta (Heiken Ashi - Delta)
haDelta is a simple formula originally developed and published by Mr. Dan Valcu. The idea behind haDelta is to quantify HA candles. One can measure momentum, which is very important when you use haDelta for reversals. It measures the difference between haClose and haOpen. Caution: High sensitivity if used.
☛ Uses Hull MA (by Allan Hull) but this one is a variation from Low lag to zero lag
Various types of moving averages exist, with the Simple Moving Average (SMA) being the most basic. However, the SMA suffers from significant lag in relation to price movements. To address this issue, the Exponential and Weighted Moving Averages were introduced, which focus more on recent data for better accuracy. Allan Hull developed the Hull Moving Average (HMA), a remarkably fast and smooth method that virtually removes lag while simultaneously enhancing smoothing. The dynamic MyRSI with NET, combined with T3 Hull MA variation, Jurik filters, and phase & smoothing, ultimately achieves optimal lag elimination for more precise results.
☛ Ehler's Deviation-Scaled Moving Average ( DSMA )
The Deviation-Scaled Moving Average (DSMA) is an innovative data smoothing technique introduced by John Ehlers in the July 2018 issue of TASC magazine. The DSMA functions as an exponential moving average with a dynamic smoothing coefficient, which adapts based on the magnitude of price changes. By utilizing the standard deviation from the mean to measure this magnitude, the DSMA provides substantial data smoothing, even when price changes are small, while swiftly adapting to these changes. As a result, this indicator offers minimal computational lag and rapid adaptation to price variations, making it an effective tool for identifying trends and potential trading opportunities.
☛ Vertical Horizontal Filter ( VHF )
The Vertical Horizontal Filter (VHF), developed by Adam White, serves as a valuable tool for identifying trending and ranging markets. Much like the ADX in the Directional Movement System, the VHF assesses the degree of trend activity, enabling traders to apply trend indicators in trending markets and momentum indicators in ranging markets. By effectively distinguishing between these market conditions, the Vertical Horizontal Filter allows for more accurate and informed decision-making when employing various trading strategies.
☛ Dominant Cycle Period ( DCP )
The DCP-generated value is being used as a dynamic Period parameter value (for dynamic MyNET).
Based on Homodyne Discriminator by John F. Ehlers, Rocket Science for Traders. This type of algorithm exhibits superior performance in a low signal-to-noise environment.
☛ Linear Momentum ─ a.k.a. MomenTicks
Linear momentum is defined as the product of a system's mass multiplied by its velocity. In symbols, linear momentum is expressed as p = mv. Momentum is directly proportional to the object's mass and also its velocity. Thus the greater an object's mass or the greater its velocity, the greater its momentum.
☛ My NET ( Noise Elimination Technology )
As a technical indicator, My NET employs Kendall correlation to eliminate nonlinear noise. However, the application of additional filters in this system results in a significantly less noisy plot than RSI.
The NET is a modified version of the RocketRSI Relative Strength Index. A one-bar close price difference is calculated as the ratio between their absolute values and the sum of the recent one-bar close price differences.
☛ Elegant Osci
In a unique update for dynamic MyNET with SmoothStep function, "An Elegant Oscillator: Inverse Fisher Transform Redux," author John Ehlers (At TASC Magazine article - February 2022) explains how he uses the inverse Fisher transform to create an indicator he calls the elegant oscillator.
First, he describes the Fisher transform before explaining the inverse Fisher transform, which provides normalization by dividing the root mean square (RMS) value into the waveform.
The elegant oscillator can spot reversion-to-the-mean opportunities with improved timing capabilities.
☛ Momentum Deviation
This is another variation of a standard deviation as it got embedded with dynamic MyNET
- it uses the momentum of price (instead of price itself) for calculation
- it is calculated in a way that it takes minimal CPU load
- As far as values are concerned, it is similar to standard deviation. Same as standard deviation -it can calculate the deviation of anything.
☛ The ADX
ADX is a very popular indicator and its elaborated form is the Average Directional Movement. Traders rely on this indicator to assess the strength of the trend. However, using the traditional ADX requires a perfect understanding of the highs and lows of the market. To make things easier, the developers have created the ADXm Indicator.
dynamic MyNET uses the ADXm algorithm.
☛ The Linear Regression-adjusted Quantitative Qualitative Estimation double
TASC magazine's August 2022 issue, featured another variant of a moving average called “The Linear Regression-Adjusted Exponential Moving Average." Author Vitali Apirine presents a technique called the linear regression-adjusted exponential moving average (LRAdj EMA) to combine a linear regression indicator with an EMA. The indicator can be used to help define turning points while filtering price movement. The LRAdj EMA can be applied in combination with a traditional exponential moving average of the same length to facilitate trend identification.
☛ Hurst Exponent with NET (a variation) - inside dynamic MyNET
In the 1970’s an American engineer called JM Hurst published a theory about why financial markets move in the way they do. The theory was the result of many years of research on powerful mainframe computers, and it became known as Hurst’s Cyclic Theory. Hurst claimed a 90% success rate trading based on his theory, and yet the theory has remained largely undiscovered and often misunderstood.
The Hurst Exponent is used as a measure of long-term memory of time series. It relates to the autocorrelations of the time series, and the rate at which these decrease as the lag between pairs of values increases. Studies involving the Hurst exponent were originally developed in hydrology for the practical matter of determining optimum dam sizing for the Nile River's volatile rain and drought conditions that had been observed over a long period. The name "Hurst exponent", or "Hurst coefficient", derives from Harold Edwin Hurst (1880 - 1978), who was the lead researcher in these studies; the use of the standard notation H for the coefficient relates to his name also.
The Hurst exponent is referred to as the "index of dependence" or "index of long-range dependence". It quantifies the relative tendency of a time series either to regress strongly to the mean or to cluster in a direction.
A value of H in the range 0.5 - 1 indicates a time series with long-term positive autocorrelation, meaning both that a high value in the series will probably be followed by another high value and that the values a long time into the future will also tend to be high.
A value of H in the range 0 - 0.5 indicates a time series with long-term switching between high and low values in adjacent pairs, meaning that a single high value will probably be followed by a low value and that the value after that will tend to be high, with this tendency to switch between high and low values lasting a long time into the future.
A value of H = 0.5 can indicate a completely uncorrelated series, but it is the value applicable to series for which the autocorrelations at small time lags can be positive or negative but where the absolute values of the autocorrelations decay exponentially quickly to zero. This is in contrast to the typical power-law decay for the 0.5 < H < 1 and 0 < H < 0.5 cases.
Hurst exponent estimation is a viable tool for analyzing the past. Looking at a correctly estimated H value can answer the following question: was the market persistent or was it anti-persistent? In turn, that would help you analyze the performance of your trading strategy or expert advisor during that particular period.
YouTube video about Hurst Trading
Note to Self: “While no methodology or system that works in every instance . . . I have never seen anything so consistent” ─ just like this system ; )─
No guarantees are provided as to the accuracy, completeness, timeliness, suitability, or accuracy of any information - such as indicators, videos, images, and charts - posted or shared here. The contents I posted here at ForexFactory (FF) are subject to modification (bound by FF and thread owner's rules and restrictions) and may have become unreliable due to a variety of factors, including changes in market conditions or economic factors.
It is important to acknowledge that trading inherently carries a degree of risk, and individual outcomes may differ. Past performance and personal experiences should not be considered indicative of future results. To assess the suitability of any investment strategy, product, or service discussed here, it is advisable to consult with a qualified investment professional who can evaluate your unique circumstances. Please note that all investments carry risks, including the potential loss of principal.
The primary intention behind sharing this information is not to gain a following or subscribers but rather to contribute to the broader trading community and maintain an online record of this system's development. Additionally, I would like to clarify that I do not have ADHD ; )─
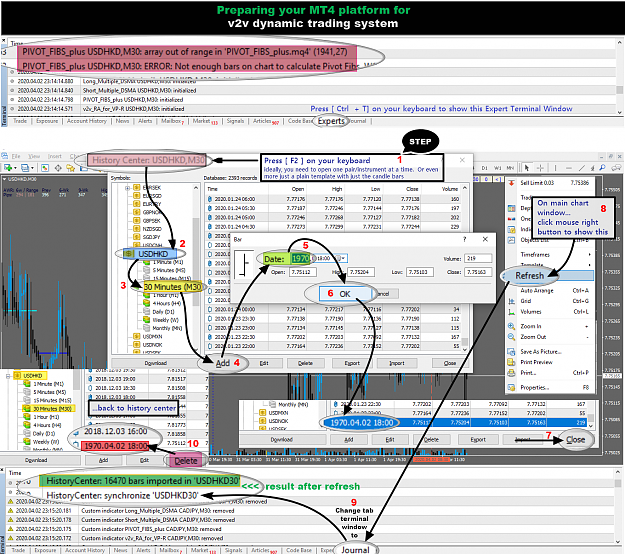
Please read the below information before loading the v2v dynamic trading system (templates) on your chart.
Each currency pair or instrument must follow the following steps to load enough tick/volume history. Thus, these are required for the system to function properly... especially if this is your first time logging in to your (new) live/demo account.
Step 1) Open an M1 chart
Step 2) Press the "F2" key to load the History Center
Step 3) Navigate to the currency pair and the "1 Minute (M1)" history data for the chart you have open in your terminal (be sure to "double click" the "1 Minute (M1)" selection in the history center so it becomes the active selection)
Step 4) Then left-click once on any of the data rows in the right-hand window of the History Center (it doesn't matter which one)
Step 5) Click the "Add" button, this pops up another window titled "Bar" and the default selection is on the "year"
Step 6) Enter 1970
Step 7) Then select "OK"... and it creates a new bar with the timestamp and price info you just added.
Step 8) Now select "Close" in the History Center
Step 9) Navigate to your M1 chart of interest and then from the terminal window (press Ctrl-T) select "Journal "-> go to the main chart window and right-click the mouse button and select "Refresh"...this will refresh the chart and attempt to fill any time gaps in the chart data (which now includes your year 1970 data point) with server data
Attached Image (click to enlarge)
...continued...
The chart will now have pulled anywhere between 2048 and 65536 M1 bars from your broker's server (not Metaquotes), which is usually more data than you can manually scroll back in time when you manually scroll your M1 chart.
If everything went smoothly... then you've quickly downloaded all the broker's M1 data on your currency pair that the broker can let you have. This is much faster than holding down the home or page-up key for minutes and minutes to get even less data. Now, you may continue with the rest of the timeframes. Once more history is downloaded, be sure to delete any 1970 dummy tick data. Next, you may need to verify that after the deletion (1970 record) the maximum historical data has been obtained, otherwise add the 1970 record again.
Note (for first-time users): The v2v dynamic system must grow with the MT4 platform as it requires a broad tick data history.
Once the platform gathers enough data, the system will no longer display an error message (viewed via Expert logs). Such as... "not enough tick data to calculate", "data horizon breach", and "array out of range".
It is important to emphasize that the v2v dynamic trading system is designed for experienced users and may not be suitable for beginners. A strong understanding of its workings is crucial to successfully utilize this system. If you find the system too complex, it would be best to explore other options that better align with your current skill level.
Effectively utilizing the v2v dynamic trading system requires due diligence, resourcefulness, and familiarity with third-party tools and indicators. With sufficient trading experience, users can better determine if the system suits their needs without resorting to negative criticism towards its creator. Remember, this system is offered free of charge, and the effort invested in its development should be appreciated.
The information provided in this system development thread journal offers a comprehensive starting point for those who wish to explore the v2v dynamic trading system. In addition to these resources, traders must also cultivate essential qualities such as patience, composure, resolve, self-discipline, and resilience, as well as the ability to make counter-intuitive decisions when necessary.
Anyway... Good luck and trade well.
✜ v2v dynamic trading system ✜
You can consider trying this v2v dynamic trading system only if your current setup is not profitable. Otherwise, it's best to move on.
The current release of the v2v dynamic trading system:
Attached File(s)
New chart templates:
• Once loaded, check/verify the indicator parameter if you prefer a recursive calculation is ON or OFF.
• PIVOT FIBS plus and Custom Candle Any-TF use a hard-coded GMT+3 broker time (Metatrader 4 platform server time).
• To keep track of market session times, you can refer to either market24hclock.com or herein at ForexFactory.
Operational setup:
In case you encounter challenges while switching between system options or adjusting your chart screen and setup, it is advisable to temporarily disable certain features, such as the dynamic MyNET or Hidden Gap finder (turn OFF). Reducing the start bar parameter value can also be helpful. Doing so will enable smoother and more efficient navigation when making adjustments, setting stop-loss and take-profit levels, or closing existing positions. Once these tasks are completed, you can reactivate the features (turn back to ON) as needed to resume utilizing the system's full capabilities.
The one below is just a Custom Candle → Any Time Frame (CC - ATF) tool on its own... With the WRB plus Hidden Gap (WRB + HG).
Attached File(s)
- The WRB and HG definitions are taken from the WRB Analysis Tutorial-1 by M.A. Perry from TheStrategyLab.com.
The below screenshot is the updated Look & Feel
Attached Image (click to enlarge)
The expert reviews...
❝ His chart... You can tell it's real because it looks so fake, honestly ❞ ; )─ Elon Musk
❝ The Swiss Army Knife for the MT4 trading platform ❞ ; )─ Chat GPT
The v2v dynamic trading system is a comprehensive suite of tools and indicators that function synergistically; thus, they should not be employed in isolation. Relying on only one or two tools may lead to inaccurate results and suboptimal trading outcomes.
This system aims to cultivate a more responsible trading approach by empowering users to harness their analytical skills more efficiently. By identifying confluences and setups, the v2v dynamic trading system offers a technical baseline bias even before price action emerges on the chart. To maximize the system's potential, users must adapt and customize its components according to their specific needs and preferences.
Members who can post in this system development thread are...
Attached Image (click to enlarge)
Since Frank Sinatra sings in his own way, my chart sing... I did it, my way