In posting this system, I want to expand the way you might use some common tools, and change the way you look at them. I have noticed that moving average crossovers are a common basis for many of the systems people use. The system I developed is such a system, but with a different slant.
I have day-traded Tbond futures with the Market Profile in the past, a system that trades around the standard deviations. I saw the benefit and reality of that system. In developing this system, I sought to maintain a few of those principles. Bollinger bands are a commonly used tool, but mostly tell you when you have reached extreme boundaries. I wanted to see more of when I started to move toward extreme movement; looking for a breakout.
Which brings me back to the MA crossover. Generally, the inherent problems with MA crossovers are that they lag, and are subject to false signals. The whole point of a system is to generate an action signal, and filter as many false signals as possible to create a good profit expectancy.
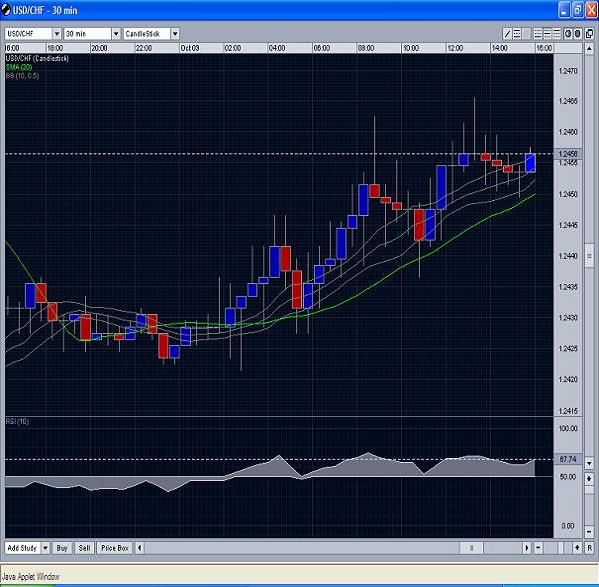
To remedy the lag, I use price plotted with a line as my fast MA, which gives me a 1 period moving average. No lag. You would think that a 1 period MA would be very erratic, but it isn't. It actually does well to filter noise. However, can we have a slow MA that isn't just getting whipsawed? Here's the fix for that. Instead of a slow MA, I use an MA envelope. Usually, an envelop is used much like a Bollinger, to create a channel. Instead, I use it as a thick MA that serves to filter many of the false crosses. But how thick to make it to balance prompt entry on new moves vs getting whipsawed.
To find the answer, I looked to standard deviation. I have found that a .5 standard deviation works well, but lacking backtesting ability at this time, I can't optimize. So I use the .5 standard deviation. I could use a bollinger set to .5 standard deviation, but the bollinger acts opposite of what I want to accomplish. On breakouts, it widens, making less room in the outer portion of breakouts. In consolidation, it squeezes too tight and produces too many whipsaws, and too narrow to represent a good breakout. This is where the MA envelope works great. The MA envelope is not supposed to change in width, but it does. In times of consolidation, it retains its proper width. When a breakout occurs with a strong move, It actually constricts, giving the breakout more room to stay outside the envelope.
In translating the .5 bollinger to an MA envelop, I put both on a chart. All you have to decide is the MA periods to base the envelop on, which is easy. Just find the MA that works best as a support and resistance for the pair and timeframe you are trading, and make that the envelope bar period. Then, look at the width of the .5 bollinger at major pivot points. That is where you want to dial in the MA envelope. When the widths at the pivots are the same width, you have your envelop shift setting, and you can delete the bollinger.
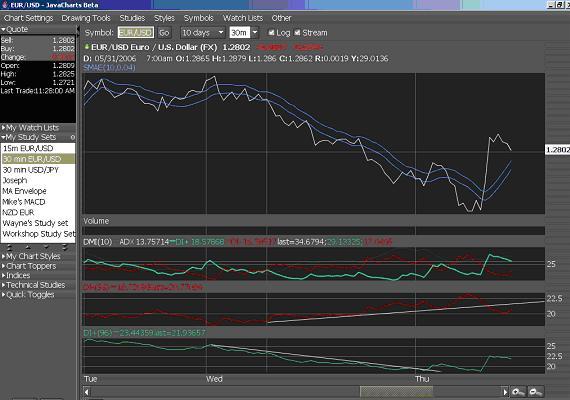
This will not filter all false signals, so we need an oscillator. I have found that the DMI works very well. I only use the D+ and D- crossovers. An MA envelope cross confirmed by simultaneous D+/D- cross is the highest probability signal. I don't use the ADX line at all.
A re-entry into the envelope followed by a new envelope breakout with the D+ or D- still above the other is a continuation signal and may be an entry, but has a lower probability. This type of entry works well when you draw a trendline on one of the D lines on the DMI to signal an exit based on the DMI trend break. Trendlines on the DMI work well for early exits near bottoms or tops.
If I get a signal, but the fast MA (price) closes back in the envelope and is confirmed by a recross of the DMIwithin two bar periods, I deem it a false signal. A confirmed signal in the opposite direction is also obviously an exit.
As a system, it works rather well, and lets you ride many of the good moves. I trade it with a large amount of discretion, however. Support and resistance breakouts or trend changes or price pattern breakouts, like flags or triangles make for premium buy or sell signals.
I primarily use this system to snag 20 pip gains in the EUR/USD pair. On a 30 minute chart, it gives me many opportunities. The settings I use on this chart are a 10 period MA envelope set to a .04 shift, and a DMI set to 10 bar periods. A 20 period MA envelope works as a more conservative element.
I have a very aggressive money management method that benefits greatly from 20 pip gains, so that was the impotus for the system, but as a stand-alone, the system works well. It works rather well in equity trading also.
For those that have backtesting capability, I'd really welcome feedback on how it tests out as a pure system. As the basis for a discretionary system, it works well for me.
I have day-traded Tbond futures with the Market Profile in the past, a system that trades around the standard deviations. I saw the benefit and reality of that system. In developing this system, I sought to maintain a few of those principles. Bollinger bands are a commonly used tool, but mostly tell you when you have reached extreme boundaries. I wanted to see more of when I started to move toward extreme movement; looking for a breakout.
Which brings me back to the MA crossover. Generally, the inherent problems with MA crossovers are that they lag, and are subject to false signals. The whole point of a system is to generate an action signal, and filter as many false signals as possible to create a good profit expectancy.
To remedy the lag, I use price plotted with a line as my fast MA, which gives me a 1 period moving average. No lag. You would think that a 1 period MA would be very erratic, but it isn't. It actually does well to filter noise. However, can we have a slow MA that isn't just getting whipsawed? Here's the fix for that. Instead of a slow MA, I use an MA envelope. Usually, an envelop is used much like a Bollinger, to create a channel. Instead, I use it as a thick MA that serves to filter many of the false crosses. But how thick to make it to balance prompt entry on new moves vs getting whipsawed.
To find the answer, I looked to standard deviation. I have found that a .5 standard deviation works well, but lacking backtesting ability at this time, I can't optimize. So I use the .5 standard deviation. I could use a bollinger set to .5 standard deviation, but the bollinger acts opposite of what I want to accomplish. On breakouts, it widens, making less room in the outer portion of breakouts. In consolidation, it squeezes too tight and produces too many whipsaws, and too narrow to represent a good breakout. This is where the MA envelope works great. The MA envelope is not supposed to change in width, but it does. In times of consolidation, it retains its proper width. When a breakout occurs with a strong move, It actually constricts, giving the breakout more room to stay outside the envelope.
In translating the .5 bollinger to an MA envelop, I put both on a chart. All you have to decide is the MA periods to base the envelop on, which is easy. Just find the MA that works best as a support and resistance for the pair and timeframe you are trading, and make that the envelope bar period. Then, look at the width of the .5 bollinger at major pivot points. That is where you want to dial in the MA envelope. When the widths at the pivots are the same width, you have your envelop shift setting, and you can delete the bollinger.
This will not filter all false signals, so we need an oscillator. I have found that the DMI works very well. I only use the D+ and D- crossovers. An MA envelope cross confirmed by simultaneous D+/D- cross is the highest probability signal. I don't use the ADX line at all.
A re-entry into the envelope followed by a new envelope breakout with the D+ or D- still above the other is a continuation signal and may be an entry, but has a lower probability. This type of entry works well when you draw a trendline on one of the D lines on the DMI to signal an exit based on the DMI trend break. Trendlines on the DMI work well for early exits near bottoms or tops.
If I get a signal, but the fast MA (price) closes back in the envelope and is confirmed by a recross of the DMIwithin two bar periods, I deem it a false signal. A confirmed signal in the opposite direction is also obviously an exit.
As a system, it works rather well, and lets you ride many of the good moves. I trade it with a large amount of discretion, however. Support and resistance breakouts or trend changes or price pattern breakouts, like flags or triangles make for premium buy or sell signals.
I primarily use this system to snag 20 pip gains in the EUR/USD pair. On a 30 minute chart, it gives me many opportunities. The settings I use on this chart are a 10 period MA envelope set to a .04 shift, and a DMI set to 10 bar periods. A 20 period MA envelope works as a more conservative element.
I have a very aggressive money management method that benefits greatly from 20 pip gains, so that was the impotus for the system, but as a stand-alone, the system works well. It works rather well in equity trading also.
For those that have backtesting capability, I'd really welcome feedback on how it tests out as a pure system. As the basis for a discretionary system, it works well for me.
Attached Image