The Swinghighlow Strategy
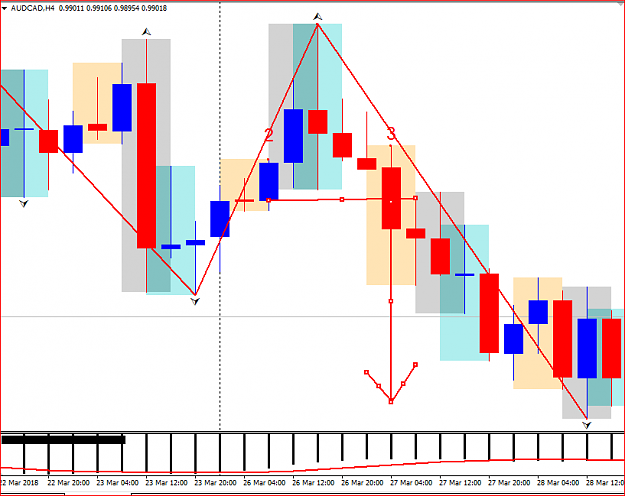
The Swinghighlow Strategy is based on trading trend Reversal and finding the candle pattern that turns the direction of trend.
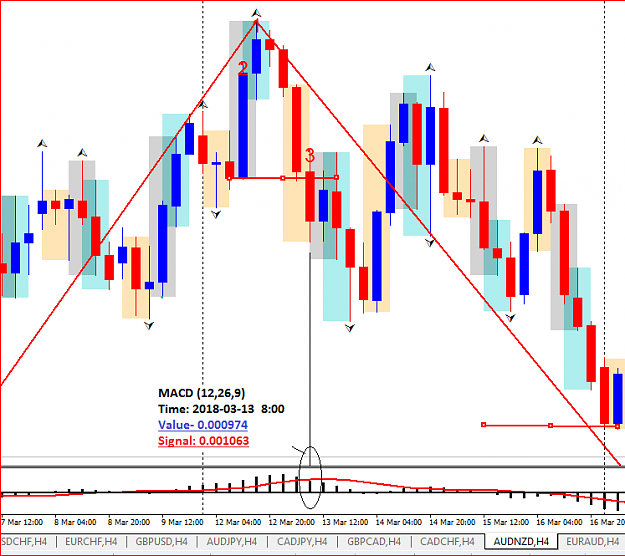
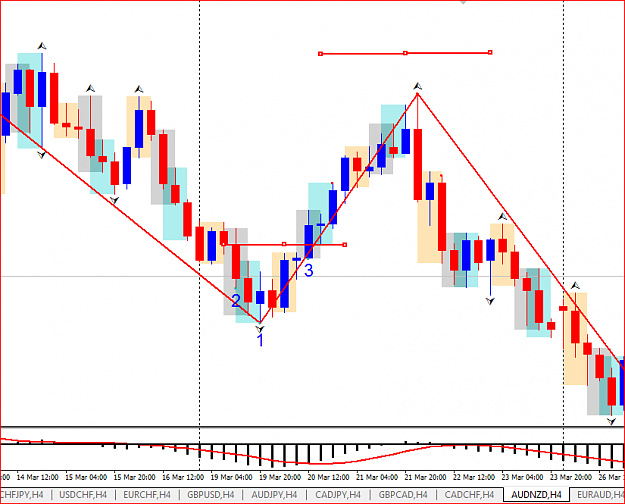
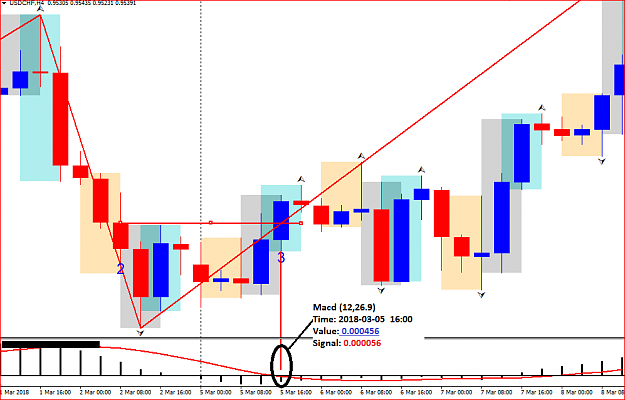
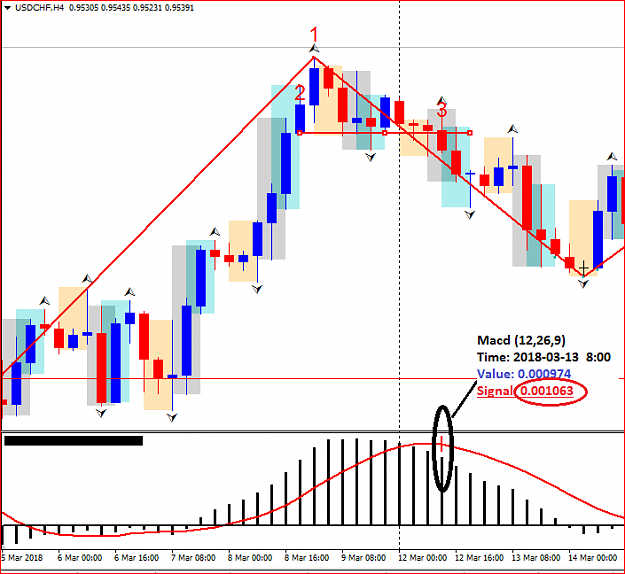
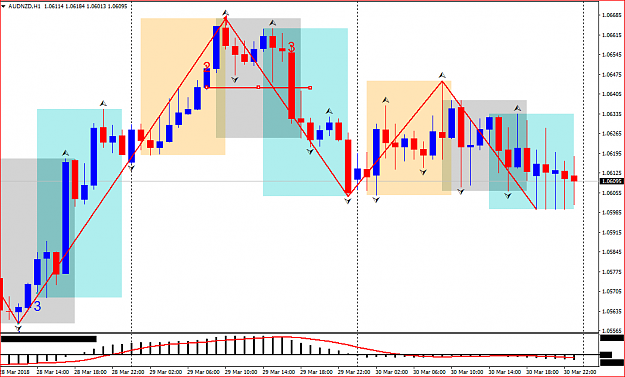
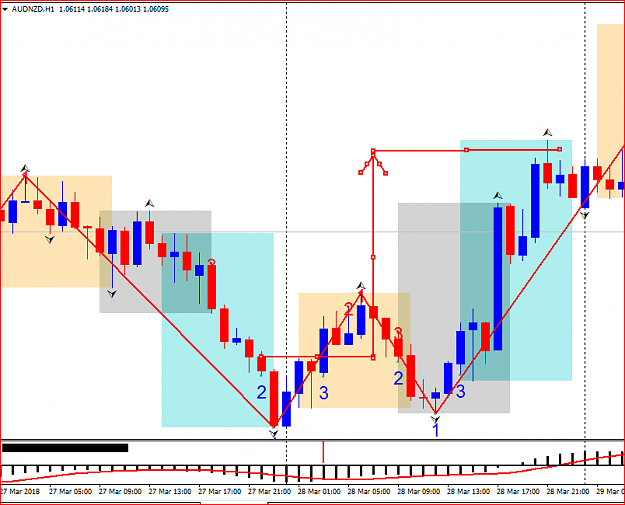
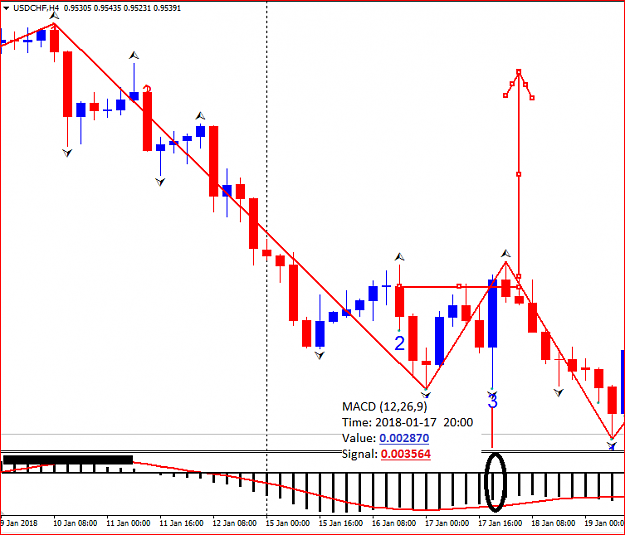
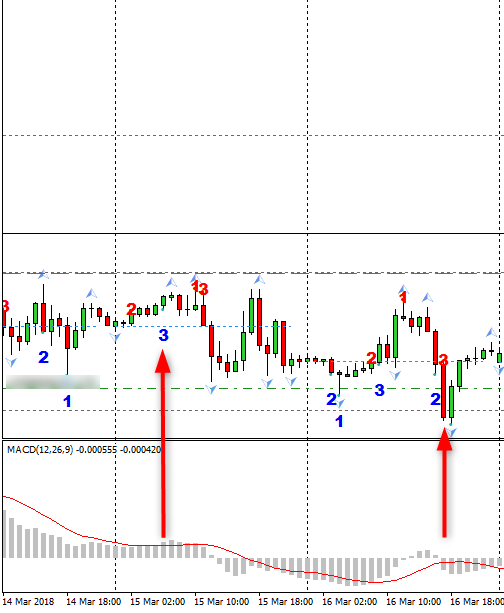
Arrows - the arrow finds a 3 candle formation setup in several different variations.
The Green/Red thick lines - This marks zones of likely reversals point. Zones if the arrows forms above/below could begin a new trend.
Dotted lines – This is also a zone marking a minor trend reversal/continuation
What is a Trend
A trending market is one in which price is generally moving in one direction.
uptrend
“higher highs” and “higher lows”
Downtrend
“lower highs” and “lower lows”.
What is Trend Reversal
Reversals are defined as a change in the overall trend of price.
- When an uptrend switches to a downtrend, a reversal occurs.
[
- When a downtrend switches to an uptrend, a reversal also occurs.
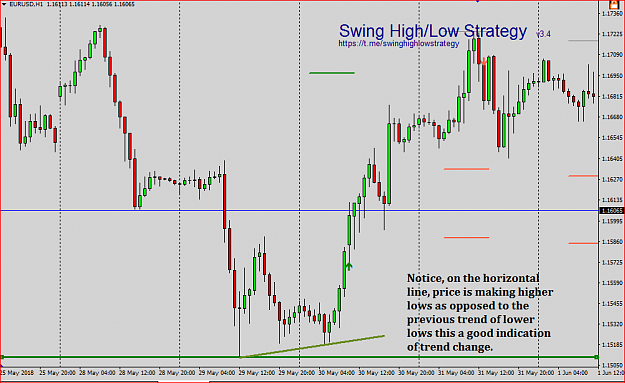
Uptrend reversal occurs when price stops making a higher highs and higher lows
Downtrend reversal occurs when price stops making a lower lows and lower highs.
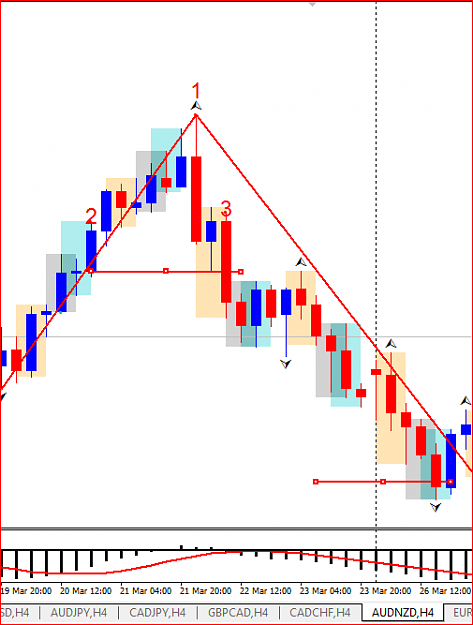
Combining it all together
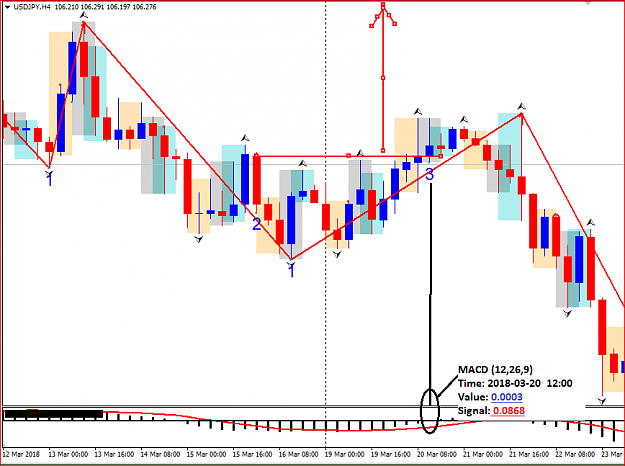
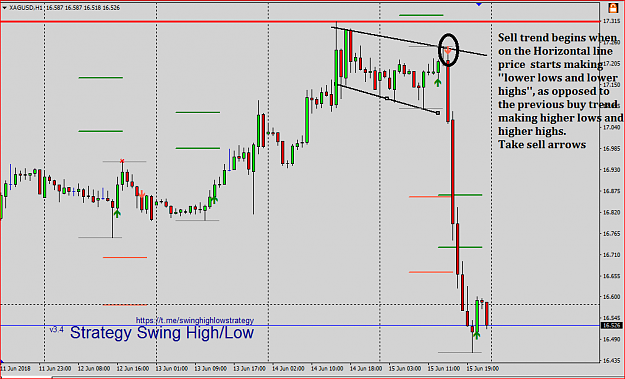
Find a Horizontal line in an Uptrend (Red)
Remember uptrend is characterized by ‘’Higher highs and higher lows’’
- Allow for price to consolidate around horizontal line
- Observe if the price formation has changed routine (of higher highs and higher lows) to ‘’lower highs and lower lows
- If this is true take arrow signals for sell
VERSION 3.4
Find download link here. It is free
https://t.me/swinghighlowstrategy/337 (Download from Telegram channel)
https://drive.google.com/file/d/1fnj...ew?usp=sharing (Download from google drive)
- A complete strategy all in one
- Pure price action
- profit target inclusive
- price action filter to avoid most pitfalls
-Repaint issue solved
- Will run commentary on all signal from indy and together discuss entry
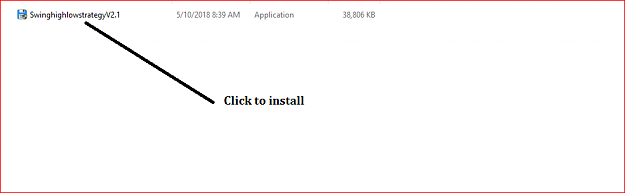
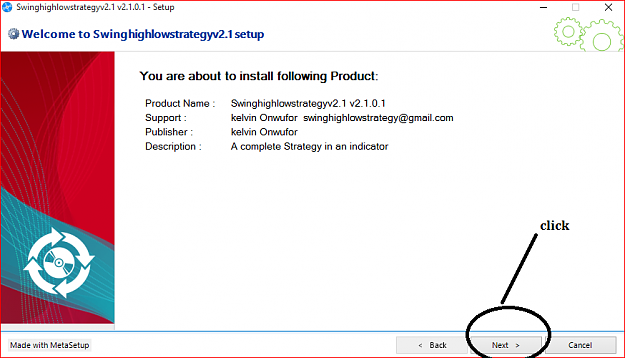
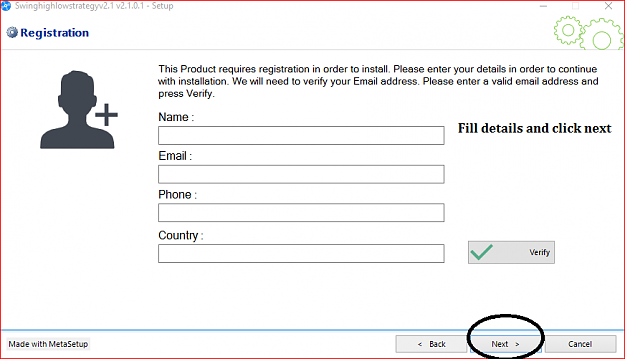
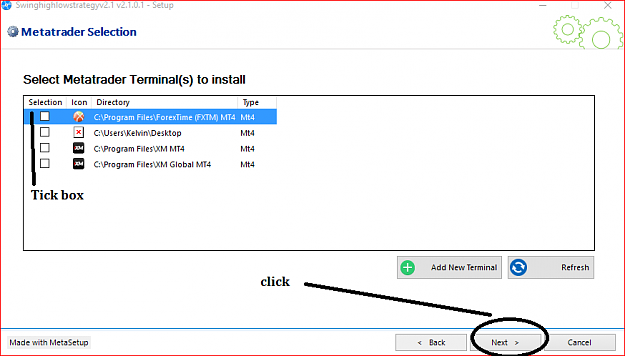
AUTOMATIC INSTALLATION USING META SETUP
recommended template setting
Attachment l
Stay tune.
Regards
Kelvin
{ virus risk deleted by staff }
The Swinghighlow Strategy is based on trading trend Reversal and finding the candle pattern that turns the direction of trend.
Arrows - the arrow finds a 3 candle formation setup in several different variations.
The Green/Red thick lines - This marks zones of likely reversals point. Zones if the arrows forms above/below could begin a new trend.
Dotted lines – This is also a zone marking a minor trend reversal/continuation
What is a Trend
A trending market is one in which price is generally moving in one direction.
uptrend
“higher highs” and “higher lows”
Downtrend
“lower highs” and “lower lows”.
What is Trend Reversal
Reversals are defined as a change in the overall trend of price.
- When an uptrend switches to a downtrend, a reversal occurs.
[
- When a downtrend switches to an uptrend, a reversal also occurs.
Uptrend reversal occurs when price stops making a higher highs and higher lows
Downtrend reversal occurs when price stops making a lower lows and lower highs.
Combining it all together
Find a Horizontal line in an Uptrend (Red)
Remember uptrend is characterized by ‘’Higher highs and higher lows’’
- Allow for price to consolidate around horizontal line
- Observe if the price formation has changed routine (of higher highs and higher lows) to ‘’lower highs and lower lows
- If this is true take arrow signals for sell
Attached Image (click to enlarge)
Attached Image (click to enlarge)
VERSION 3.4
Attached Image (click to enlarge)
Find download link here. It is free
https://t.me/swinghighlowstrategy/337 (Download from Telegram channel)
https://drive.google.com/file/d/1fnj...ew?usp=sharing (Download from google drive)
Attached File(s)
- A complete strategy all in one
- Pure price action
- profit target inclusive
- price action filter to avoid most pitfalls
-Repaint issue solved
- Will run commentary on all signal from indy and together discuss entry
AUTOMATIC INSTALLATION USING META SETUP
Attached Image (click to enlarge)
Attached Image (click to enlarge)
Attached Image (click to enlarge)
Attached Image (click to enlarge)
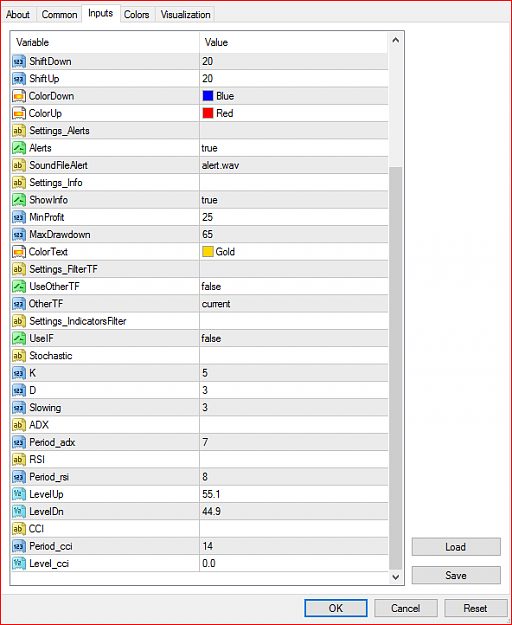
recommended template setting
Attachment l
Stay tune.
Regards
Kelvin
{ virus risk deleted by staff }