Hi, and thanks for stopping by!
Regardless if you're new or old member of the forum, keep reading here and I promise you will not be disappointed!
From my point of view this thread is the natural continuation of the thread "Higher Edge within a Single Candlestick” and here I intend to share with you some of my discoveries regarding this concept.
As I commented in the original thread, I believe that we can create and apply multiple strategies only by using the information which is present inside a single candlestick.
However I want to distance myself from the candlestick as a tool simply because we do not need candlesticks. I think they are just unnecessary distraction.
We are going to focus on the raw data.
That's why I want to concentrate and to bring to your attention the concept of the natural trading cycles. Primarily the daily cycle and to some extend the weekly cycle.
Later in the thread I will attempt to explain the relationships between time and price which exist inside each trading cycle. These relationships are the foundation of the strategy which you are going to learn in this thread.
So, let's get started!
First if we want to have clear understanding, we have to define the main terms.
Time! All times in this thread are based on GMT+2. This is my time zone and also the unofficial time zone from which we determine the start and the end of each day on the Forex market.
The majority of the reputable brokers use GMT+2 on their servers. So 00:00 on GMT+2 is exactly in the middle of the most inactive period. (After US close and before Asia open) This is the start of the daily candle.
What is "trading cycle"? It's very simple. The trading cycle constitutes a fixed period of time during which we have mostly uninterrupted trading activity. Each cycle is separated from the other cycles by a period of time with very low or no trading activity.
On the Forex market we have only 2 natural cycles. Daily and Weekly.
The daily cycle starts at 01:00 and ends at 23:00 each day.
The weekly cycle starts Monday at 01:00 and ends Friday at 23:00.
In our strategy we are looking at each cycle as independent event!
High and Low. When I say high or low, I mean the highest or the lowest price of the current cycle.
Range. The range is simply (high – low) for the current cycle.
Mid - this is the middle of the range. Or, mid=high-(range*0.5); Or (high+low)/2;
sqrt(t) - This is the square root of time. For now we don't need this. But we're going to use this calculation later in the second layer of the strategy. (Where we add some more complicated optimizations).
So let's get down to the basics of the strategy. I use the daily cycle, but you can apply the same rules to the weekly.
First we create the framework. For simplicity in this example we assume that the cycle starts and ends at 00:00.
So let's imagine a rectangular flat plane.
The vertical dimension is a variable and it's determined by the price. (The range)
The horizontal dimension is fixed and in our example is equal to 24 hours.
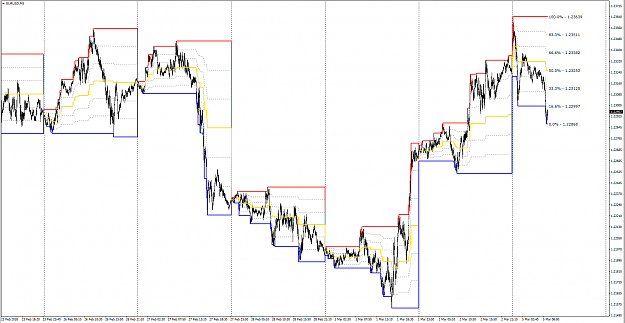
With this plane we continuously track the location (the coordinates) of the current price, the high, the low, and the middle.
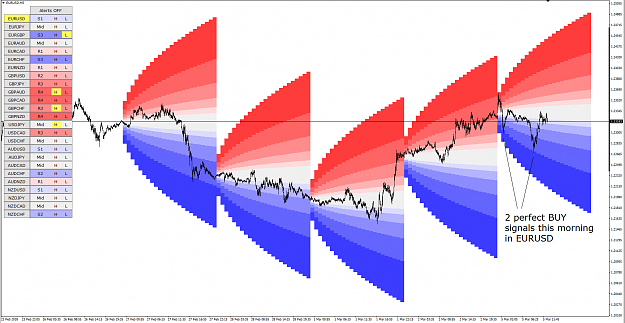
Here you can see one very common example of completed daily cycle.
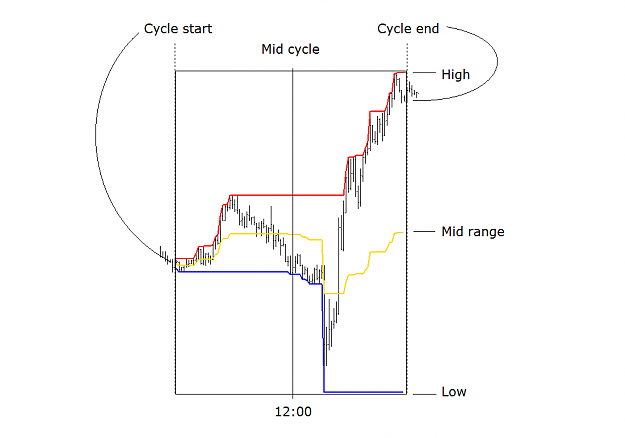
Notice that we also track the location of the current time in relation to the mid cycle. In the base model we use 12:00. Later when we apply the second layer of the system we can shift this value back or forward in order to optimize the strategy.
The location of the "middle" of the cycle in part determines the aggressiveness of the strategy. The further away it is from the start - the higher the risk. From this will emerge all kinds of implications in terms of the probability distributions. (I will explain the mechanics later)
Now let's see how we can utilize all this information. Keep in mind that later we can modify some of the parameters for better optimization but the main structure of the system always stays the same!
Here are the basic trading rules. I explain only for SELL position. The BUY is the same but inverted.
We split each position into multiple units. The positions are build using inverted pyramidal structure. We build the position by "scaling in" UP TO the maximum size. (Not on top of the maximum). The maximum depends on account size, risk appetite and a few other things.
1. Initial signal. (If there is no open position)
We SELL 1 unit when the current price is equal to the highest price for the current cycle AND the current time is below the mid cycle. (In our example before 12:00)
2. Secondary signal. (Position build-up).
If the current price is above the previous entry price + X, then we add 2 units.
X is a variable which we determine with optimization. As a standard in the first layer we can use 10% ADR. In the second layer we can add nonlinear calculation with sqrt(t). But for now we don't need this. You just have to understand the basic structure.
So with this system we build inverted pyramid.
Initial open 1
If the price is above 1+X then we add 2.
If the price is above 2+X then we add 3.
We can keep adding until we reach the maximum position size. 1+2+3+4+5..........
3. Position Close.
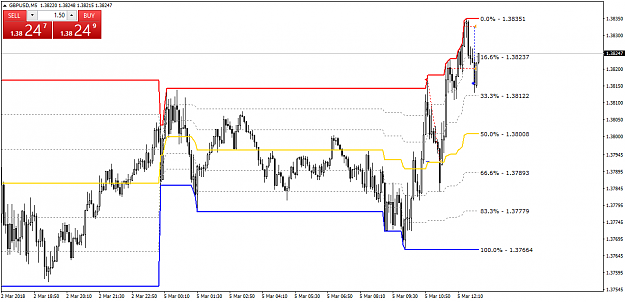
If we have open position and the current time is before the mid cycle (12:00), then we look for correction to the mid range. (50% retracement from the high)
If the current time is after 12.00, then we look for 25% retracement from the high.
In the second layer we are going to add more precise and continuous calculation using nonlinear formula. For now it's not necessary.
Regardless of the outcome during the trading cycle, ALL positions are closed at the end of the cycle. I our example at 00:00 or at 23:00.
-------------------------------------------------------------------------------------------------------------------------------------------------------------------
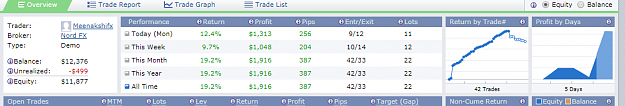
Ok. This is the foundation of the strategy! Even with these simple rules, this strategy will generate at least 85-90% profitable days. Or 9 out of 10. Average RR on trade by trade basis is above 1:1,5 (or closer to 2) and win% is over 60% for sure.
But when we add the second layer with all optimizations and more precise calculation we can bring the success rate up to 98%+ profitable days.
Here you can also download the indicator which tracks the cycles. It's very useful tool for visual/manual backtesting. At least I use it a lot.
Who knows, if you dig deep enough, maybe you will discover the other secret strategies based on a single candlestick. As I said there are at least 2 more.
You can expect more details in the next posts. (When I have time).
And I promise you that when I finish with this thread, everyone reading this will have the opportunity to make money with this system!
Regardless if you're new or old member of the forum, keep reading here and I promise you will not be disappointed!
From my point of view this thread is the natural continuation of the thread "Higher Edge within a Single Candlestick” and here I intend to share with you some of my discoveries regarding this concept.
As I commented in the original thread, I believe that we can create and apply multiple strategies only by using the information which is present inside a single candlestick.
However I want to distance myself from the candlestick as a tool simply because we do not need candlesticks. I think they are just unnecessary distraction.
We are going to focus on the raw data.
That's why I want to concentrate and to bring to your attention the concept of the natural trading cycles. Primarily the daily cycle and to some extend the weekly cycle.
Later in the thread I will attempt to explain the relationships between time and price which exist inside each trading cycle. These relationships are the foundation of the strategy which you are going to learn in this thread.
So, let's get started!
First if we want to have clear understanding, we have to define the main terms.
Time! All times in this thread are based on GMT+2. This is my time zone and also the unofficial time zone from which we determine the start and the end of each day on the Forex market.
The majority of the reputable brokers use GMT+2 on their servers. So 00:00 on GMT+2 is exactly in the middle of the most inactive period. (After US close and before Asia open) This is the start of the daily candle.
What is "trading cycle"? It's very simple. The trading cycle constitutes a fixed period of time during which we have mostly uninterrupted trading activity. Each cycle is separated from the other cycles by a period of time with very low or no trading activity.
On the Forex market we have only 2 natural cycles. Daily and Weekly.
The daily cycle starts at 01:00 and ends at 23:00 each day.
The weekly cycle starts Monday at 01:00 and ends Friday at 23:00.
In our strategy we are looking at each cycle as independent event!
High and Low. When I say high or low, I mean the highest or the lowest price of the current cycle.
Range. The range is simply (high – low) for the current cycle.
Mid - this is the middle of the range. Or, mid=high-(range*0.5); Or (high+low)/2;
sqrt(t) - This is the square root of time. For now we don't need this. But we're going to use this calculation later in the second layer of the strategy. (Where we add some more complicated optimizations).
So let's get down to the basics of the strategy. I use the daily cycle, but you can apply the same rules to the weekly.
First we create the framework. For simplicity in this example we assume that the cycle starts and ends at 00:00.
So let's imagine a rectangular flat plane.
The vertical dimension is a variable and it's determined by the price. (The range)
The horizontal dimension is fixed and in our example is equal to 24 hours.
With this plane we continuously track the location (the coordinates) of the current price, the high, the low, and the middle.
Here you can see one very common example of completed daily cycle.
Attached Image (click to enlarge)
Notice that we also track the location of the current time in relation to the mid cycle. In the base model we use 12:00. Later when we apply the second layer of the system we can shift this value back or forward in order to optimize the strategy.
The location of the "middle" of the cycle in part determines the aggressiveness of the strategy. The further away it is from the start - the higher the risk. From this will emerge all kinds of implications in terms of the probability distributions. (I will explain the mechanics later)
Now let's see how we can utilize all this information. Keep in mind that later we can modify some of the parameters for better optimization but the main structure of the system always stays the same!
Here are the basic trading rules. I explain only for SELL position. The BUY is the same but inverted.
We split each position into multiple units. The positions are build using inverted pyramidal structure. We build the position by "scaling in" UP TO the maximum size. (Not on top of the maximum). The maximum depends on account size, risk appetite and a few other things.
1. Initial signal. (If there is no open position)
We SELL 1 unit when the current price is equal to the highest price for the current cycle AND the current time is below the mid cycle. (In our example before 12:00)
2. Secondary signal. (Position build-up).
If the current price is above the previous entry price + X, then we add 2 units.
X is a variable which we determine with optimization. As a standard in the first layer we can use 10% ADR. In the second layer we can add nonlinear calculation with sqrt(t). But for now we don't need this. You just have to understand the basic structure.
So with this system we build inverted pyramid.
Initial open 1
If the price is above 1+X then we add 2.
If the price is above 2+X then we add 3.
We can keep adding until we reach the maximum position size. 1+2+3+4+5..........
3. Position Close.
If we have open position and the current time is before the mid cycle (12:00), then we look for correction to the mid range. (50% retracement from the high)
If the current time is after 12.00, then we look for 25% retracement from the high.
In the second layer we are going to add more precise and continuous calculation using nonlinear formula. For now it's not necessary.
Regardless of the outcome during the trading cycle, ALL positions are closed at the end of the cycle. I our example at 00:00 or at 23:00.
-------------------------------------------------------------------------------------------------------------------------------------------------------------------
Ok. This is the foundation of the strategy! Even with these simple rules, this strategy will generate at least 85-90% profitable days. Or 9 out of 10. Average RR on trade by trade basis is above 1:1,5 (or closer to 2) and win% is over 60% for sure.
But when we add the second layer with all optimizations and more precise calculation we can bring the success rate up to 98%+ profitable days.
Here you can also download the indicator which tracks the cycles. It's very useful tool for visual/manual backtesting. At least I use it a lot.
Attached File(s)
Who knows, if you dig deep enough, maybe you will discover the other secret strategies based on a single candlestick.
Attached Image (click to enlarge)
You can expect more details in the next posts. (When I have time).
And I promise you that when I finish with this thread, everyone reading this will have the opportunity to make money with this system!