Hey guys, after reading this forum for a long time and obtaining so much value I thought it was only fair that for my first post I would give some value back to the community.
My preferred trading style is price action/candle stick patterns as it makes the most sense to me. I’ve read pretty much all of Steve Nison’s content. I then came across Walter Peters book the Naked Forex and was instantly hooked. His rules were clear which made it easy to identify certain patterns. My problem was is that I would have to sit there and check each bar if the criteria had been met. There had to be another way?
With all my knowledge on candlestick patterns I have started my quest on creating an all in one price action indicator for MT4. I am no coder so have hired someone to do this for me. I am happy to say that I would like share version 1.0 with the community. I decided to give the indicator a name One Glance Trader (OGT) Price Action indicator. I came up with the name OGT because you can visually see any opportunities instantly!
What is included in version 1.0
This version only contains one pattern which is the pin bar/kangaroo tail (as Walter puts it). I have had coded the rules from his book and YouTube videos. Here are the rules applied:
1) Open and close are inside the previous candle
Self-explanatory hard coded in indicator
2) Open and close are in the bottom third (bearish)/ top third (bullish) of the candle's range
Self-explanatory hard coded in indicator
3) Decent amount of "room to the left"
Walter talks about pin bars forming at a price where price has not been for a very long time, creating a better indication of a reversal. To apply this in the indicator it checks if the top/bottom of the rejection wick has been where price has not been for a long time. You can set the amount of the wick (in %) and it will tell you how many bars ago price was (see image below for example).
4) Candle range greater than the previous 4 candles
Self-explanatory, you can set the number of previous candles to check.
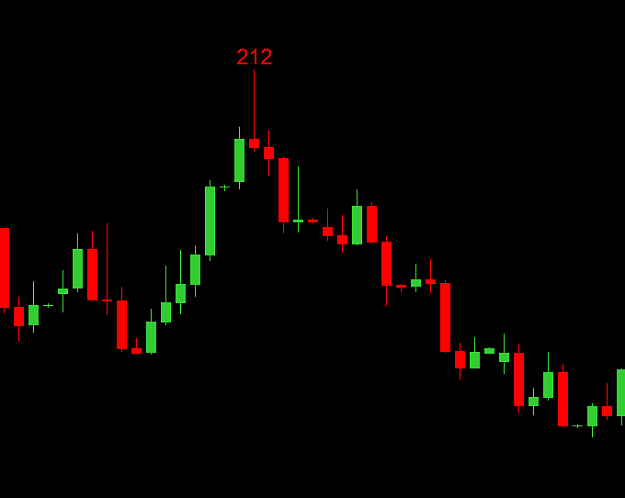
As you can see from the image above, the above pin bar formed meets all the rules. This is EUR/USD Daily chart. The Pin bar was formed on April 3rd 2017. The number (212) means that the top 25% of the rejection wick has not been at that price for the last 212 bars (212 days). The number is in red to represent a sell signal. As you can see there was a circa 450 pip selloff.
I would not use this indicator as a standalone indicator. Use other indicators/PA for confluence.
I have created a video that goes into the settings in much more detail and how to use it properly.
I am looking for your feedback to improve the indicator and also what patterns you want to see in the upcoming versions.
-------------------Downloads & Tutorials-------------------
Latest version will include all patterns from prior versions. Please watch all previous tutorial videos as new version tutorials only over the new features.
OGT Price Action Indicator v1.3 (Tutorial covers displaying signals that are only with the trend)
OGT Price Action Indicator v1.2 (Tutorial covers the inside bar and marubozu)
OGT Price Action Indicator v1.1 (Tutorial covers the engulfing and doji)
OGT Price Action Indicator v1.0 (Tutorial covers the pin bar)
Enjoy
Zoheb.
My preferred trading style is price action/candle stick patterns as it makes the most sense to me. I’ve read pretty much all of Steve Nison’s content. I then came across Walter Peters book the Naked Forex and was instantly hooked. His rules were clear which made it easy to identify certain patterns. My problem was is that I would have to sit there and check each bar if the criteria had been met. There had to be another way?
With all my knowledge on candlestick patterns I have started my quest on creating an all in one price action indicator for MT4. I am no coder so have hired someone to do this for me. I am happy to say that I would like share version 1.0 with the community. I decided to give the indicator a name One Glance Trader (OGT) Price Action indicator. I came up with the name OGT because you can visually see any opportunities instantly!
What is included in version 1.0
This version only contains one pattern which is the pin bar/kangaroo tail (as Walter puts it). I have had coded the rules from his book and YouTube videos. Here are the rules applied:
1) Open and close are inside the previous candle
Self-explanatory hard coded in indicator
2) Open and close are in the bottom third (bearish)/ top third (bullish) of the candle's range
Self-explanatory hard coded in indicator
3) Decent amount of "room to the left"
Walter talks about pin bars forming at a price where price has not been for a very long time, creating a better indication of a reversal. To apply this in the indicator it checks if the top/bottom of the rejection wick has been where price has not been for a long time. You can set the amount of the wick (in %) and it will tell you how many bars ago price was (see image below for example).
4) Candle range greater than the previous 4 candles
Self-explanatory, you can set the number of previous candles to check.
Attached Image (click to enlarge)
As you can see from the image above, the above pin bar formed meets all the rules. This is EUR/USD Daily chart. The Pin bar was formed on April 3rd 2017. The number (212) means that the top 25% of the rejection wick has not been at that price for the last 212 bars (212 days). The number is in red to represent a sell signal. As you can see there was a circa 450 pip selloff.
I would not use this indicator as a standalone indicator. Use other indicators/PA for confluence.
I have created a video that goes into the settings in much more detail and how to use it properly.
I am looking for your feedback to improve the indicator and also what patterns you want to see in the upcoming versions.
-------------------Downloads & Tutorials-------------------
Latest version will include all patterns from prior versions. Please watch all previous tutorial videos as new version tutorials only over the new features.
OGT Price Action Indicator v1.3 (Tutorial covers displaying signals that are only with the trend)
Inserted Video
Attached File(s)
OGT Price Action Indicator v1.2 (Tutorial covers the inside bar and marubozu)
Inserted Video
Attached File(s)
OGT Price Action Indicator v1.1 (Tutorial covers the engulfing and doji)
Inserted Video
Attached File(s)
OGT Price Action Indicator v1.0 (Tutorial covers the pin bar)
Inserted Video
Attached File(s)
Enjoy
Zoheb.
Never stop investing. Never stop improving. Never stop doing something new