السلام على من اتبع الهدى
hi, all
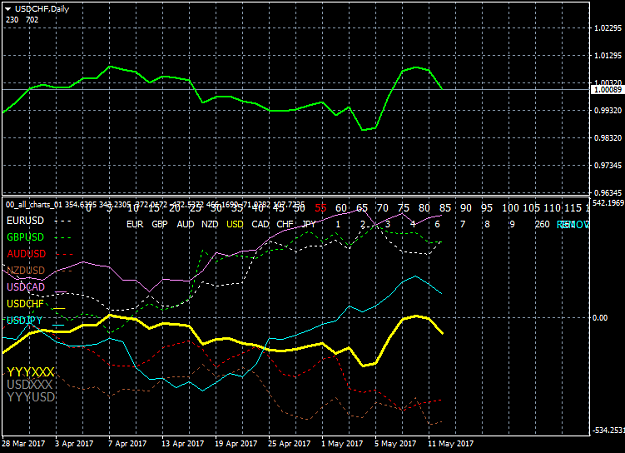
we speak here about chart scaling,
Q: I want to draw many instruments on single chart, for example eur.usd, gbp.jpy, gold, etc...
we must do it accurately, i.e. correct shape, correct prices, etc . .
0: is zero
1: is one
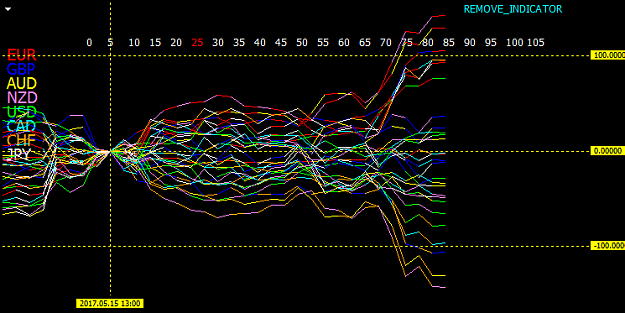
A) SHIFT TO 0-AXIS
simply we have to fix reference time in the past, then we make some shift for all these instruments.
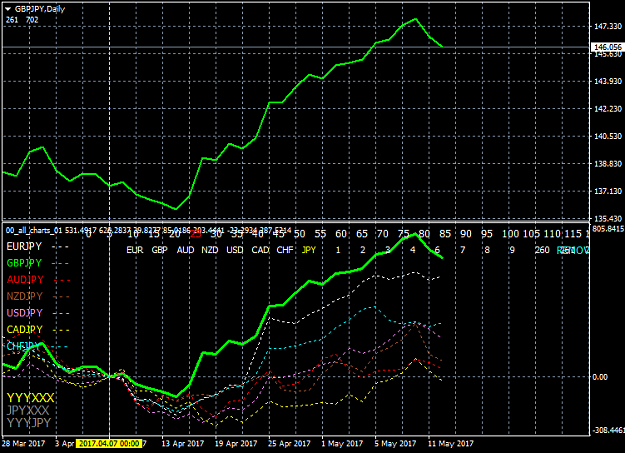
GBPJPY before one month was 140.00, now is 148.00
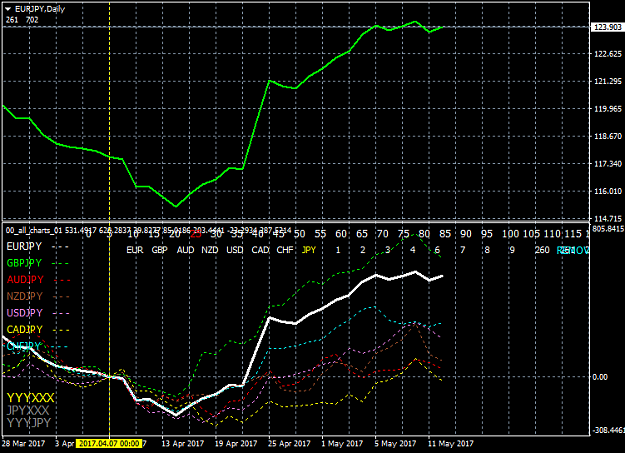
EURUSD before one month was 1.0600, now is 1.0900
as u see, ca not be put on the same chart because of scale,
but with some appropriate shift, you can unify scale.
does 148.00 itself matter? absolutely no, what matter is the difference in pips.
so simply we minus 140.00 form each candle price,
148.00-140.00 = 800.0 pips
1.0900-1.0600 = 300 pips.
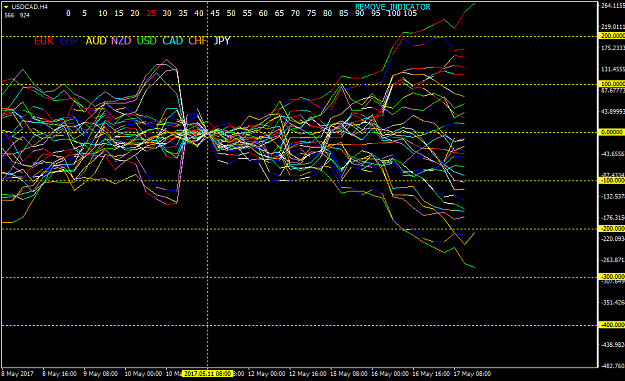
B) COMPRESS TO UNITY
when GBPJPY moves up 100 pips and EURUSD moves up 90 pips, that does not mean GBPJPY have the strongest movement.
we have to check the percentage of movement to get accurate results, that means converting prices to unity 1.0000
GBPJPY ref price = 140.00 ---> convert to 1.0000 by dividing on 140.000
140.000/140.000 = 1.0000
now price goes up by 100 pips, 141.00
so 141.00/140.00 = 1.0071
the new price for GBPJPY = 1.0071 (CORRESPONDS TO 141.00)
EURUSD ref price = 1.0600 ---> convert to 1.0000 by dividing on 1.0600
now price goes up by 90 pips, 1.0690
so 1.0690/1.0600= 1.0085
the new price for EURUSD = 1.0085 (CORRESPONDS TO 1.0690)
so eurusd was stronger than gbpjpy, even later was greater in pips magnitude.
Don not let magnitude cheat you. check percent first.
Conclusion:
in this way, you can draw GBPJPY and EURUSD on the same chart. compare 1.0085 to 1.0071
simply, shift all new chart values by -1, to get starting price of 0.000 for all instruments on chart.
hi, all
we speak here about chart scaling,
Q: I want to draw many instruments on single chart, for example eur.usd, gbp.jpy, gold, etc...
we must do it accurately, i.e. correct shape, correct prices, etc . .
0: is zero
1: is one
A) SHIFT TO 0-AXIS
simply we have to fix reference time in the past, then we make some shift for all these instruments.
GBPJPY before one month was 140.00, now is 148.00
EURUSD before one month was 1.0600, now is 1.0900
as u see, ca not be put on the same chart because of scale,
but with some appropriate shift, you can unify scale.
does 148.00 itself matter? absolutely no, what matter is the difference in pips.
so simply we minus 140.00 form each candle price,
148.00-140.00 = 800.0 pips
1.0900-1.0600 = 300 pips.
B) COMPRESS TO UNITY
when GBPJPY moves up 100 pips and EURUSD moves up 90 pips, that does not mean GBPJPY have the strongest movement.
we have to check the percentage of movement to get accurate results, that means converting prices to unity 1.0000
GBPJPY ref price = 140.00 ---> convert to 1.0000 by dividing on 140.000
140.000/140.000 = 1.0000
now price goes up by 100 pips, 141.00
so 141.00/140.00 = 1.0071
the new price for GBPJPY = 1.0071 (CORRESPONDS TO 141.00)
EURUSD ref price = 1.0600 ---> convert to 1.0000 by dividing on 1.0600
now price goes up by 90 pips, 1.0690
so 1.0690/1.0600= 1.0085
the new price for EURUSD = 1.0085 (CORRESPONDS TO 1.0690)
so eurusd was stronger than gbpjpy, even later was greater in pips magnitude.
Don not let magnitude cheat you. check percent first.
Conclusion:
in this way, you can draw GBPJPY and EURUSD on the same chart. compare 1.0085 to 1.0071
simply, shift all new chart values by -1, to get starting price of 0.000 for all instruments on chart.
Forex Philosopher