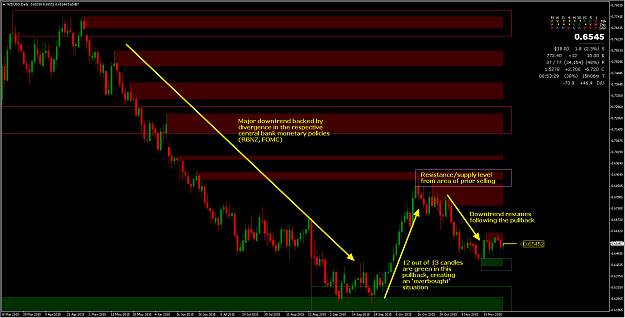
Hey guys, while doing the usual weekend studies I came up with a simple idea after reading a strategy about buying or selling after 7 consecutive day days either up or down.. So if 7 down days, buy on open, and opposite for 7 up days..
Using this and a handy script Ive had for a while I thought it should be simple to do. Although waiting for 7 up or down consecutive candles on the daily would be very rare maybe coming down to 4-5 would be more suitable.
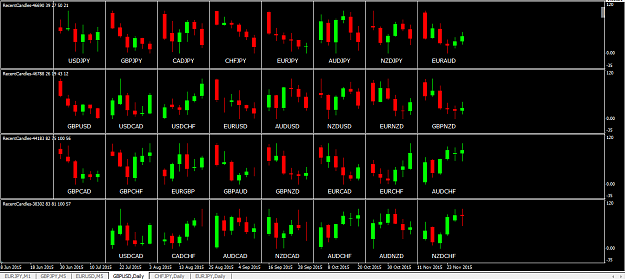
So I set up a mt4 to show most of the pairs and their recent daily candles.
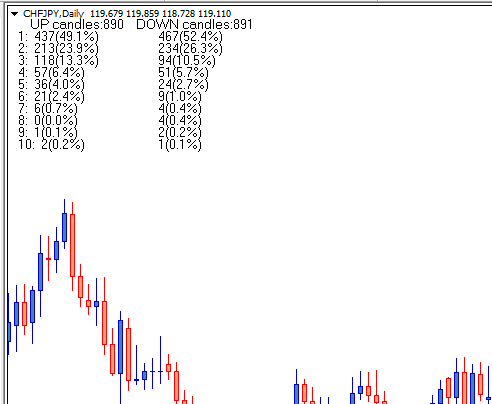
Then using the script Ill attach I can run it on the daily chart and it pops up with the statistics as shown in the top of my screencap. So we see the occurrence of each possible combinations of candles.. So example there were 36 occurrences of 5 up candles and 24 occurrences of 5 down candles over the data I have..
So then looking at the percentages I would add up the percentages before the 5 consecutive eg (49.1+23.9+13.3+6.4) to get 92.7.. So 92.7 of the time we get 4 or less consecutive candles..Meaning that only 7.3 percent of the time we get more than 4 candles for this pair.. Running it on the daily of a few others you see alot come out roughly the same. So looking at my minicharts I quickly see CHFJPY has come down 4 days so would be looking to long somewhere possibly.
Using this we could just scan the little chart each day and wait for our 4-5 consecutive candles and then check with the script if the pair to check. Then simply place a buy or sell on open or look for a really obvious place for it to turn such as daily low/high..
Anyone done anything like this before or have some opinions?
Using this and a handy script Ive had for a while I thought it should be simple to do. Although waiting for 7 up or down consecutive candles on the daily would be very rare maybe coming down to 4-5 would be more suitable.
So I set up a mt4 to show most of the pairs and their recent daily candles.
Then using the script Ill attach I can run it on the daily chart and it pops up with the statistics as shown in the top of my screencap. So we see the occurrence of each possible combinations of candles.. So example there were 36 occurrences of 5 up candles and 24 occurrences of 5 down candles over the data I have..
So then looking at the percentages I would add up the percentages before the 5 consecutive eg (49.1+23.9+13.3+6.4) to get 92.7.. So 92.7 of the time we get 4 or less consecutive candles..Meaning that only 7.3 percent of the time we get more than 4 candles for this pair.. Running it on the daily of a few others you see alot come out roughly the same. So looking at my minicharts I quickly see CHFJPY has come down 4 days so would be looking to long somewhere possibly.
Using this we could just scan the little chart each day and wait for our 4-5 consecutive candles and then check with the script if the pair to check. Then simply place a buy or sell on open or look for a really obvious place for it to turn such as daily low/high..
Anyone done anything like this before or have some opinions?
Attached Image (click to enlarge)
Attached Image
Attached File(s)
nollej is power..