Hello everyone. I've got a non repainting zig zag indicator that I'd like any decent coder to please help tweak it a bit. I read a little about the zig zag & it was said that it plots the lines based on a specific amount of retracement points/percentage from the last plotted line. I suspect that not all zig zag indicators use the same methods of calculation so my request is solely focused on the one I'll attach here.
My question is it possible to modify the indicator so that it displays a price level, on the chart, where a zig zag line will be plotted for the last wave?
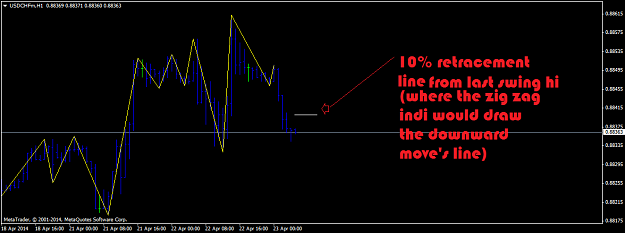
Here's a simple visual example of what I mean (Lets assume in this example that the retracement needed in this example is 10% of the previous swing hi/low for the zig zag line to be plotted) :
& here's the indicator:
(again, the modification should be according to the mechanics of the attached indicator)
Your help is GREATLY APPRECIATED!
ThankYou
My question is it possible to modify the indicator so that it displays a price level, on the chart, where a zig zag line will be plotted for the last wave?
Here's a simple visual example of what I mean (Lets assume in this example that the retracement needed in this example is 10% of the previous swing hi/low for the zig zag line to be plotted) :
Attached Image (click to enlarge)
& here's the indicator:
Attached File(s)
(again, the modification should be according to the mechanics of the attached indicator)
Your help is GREATLY APPRECIATED!
ThankYou