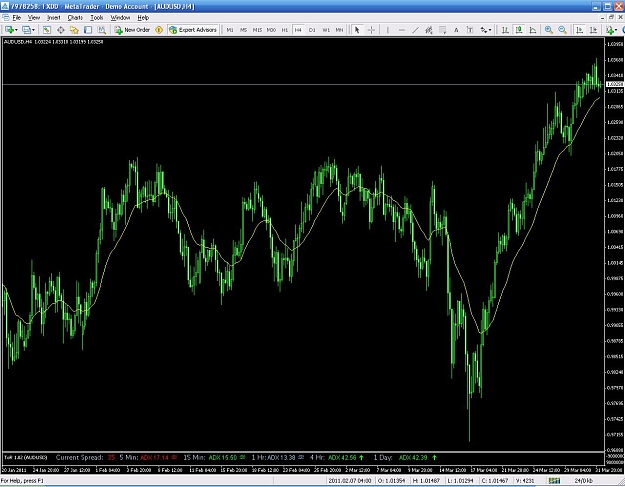
The Average Directional Movement Indicator is an indicator that's very powerful yet seldom understood. I found a multi timeframe indicator that shows the strength of the trend (and in what direction) for 5m,15m,1h,4h,1D.
My intentions are to couple this indicator with a 20wma and only trade long/short when the price is above/below the 20wma and the 1H,4H,1D ADX values are above 25 and green for longs and red for shorts.
*Stops are 3% (or whatever the trader would like) of account for 2ATR of whatever timeframe they choose. This adjusts for volatility in the market.
*Take Profit is 4ATR or a user defined profit % (ie. 5% of account). Positive expectation based on current volatility.
Would someone be able to put a mechanical EA together to trade based on these principles and have the ability to test it in the strategy tester? The strategy and potential for profit is there with defined stops, mm, and tp based off of a positive expectation strategy. Any help would be appreciated!
Indicator and pic below.
Attached Image (click to enlarge)
Attached File(s)