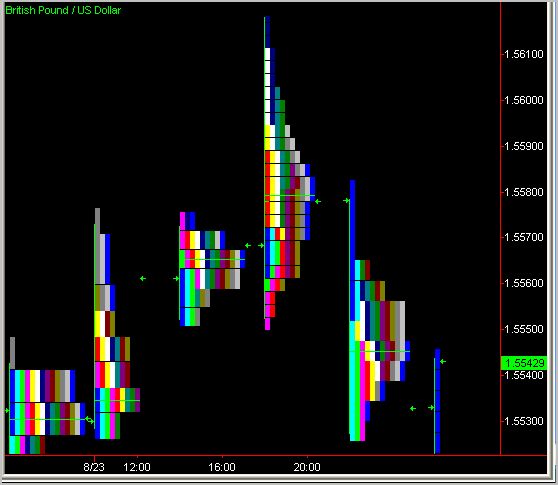
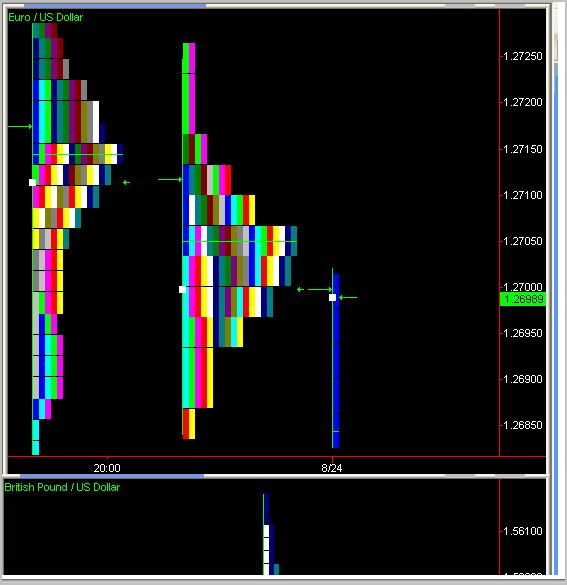
Came across these recently ... and would like to know what they are, and if possible, how they are constructed.
My first thoughts are that they are a form of correlation chart.
Any ideas?
Best wishes
Ingot54
My first thoughts are that they are a form of correlation chart.
Any ideas?
Best wishes
Ingot54
Attached Images