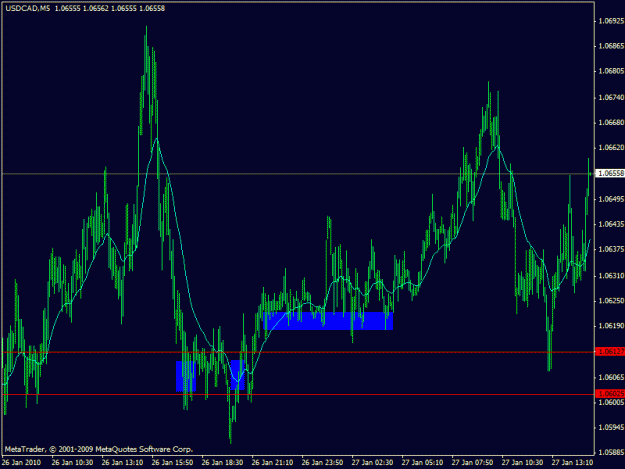
Hey, I'm new to FOREX and I thought this would be a fun experience. I'm going to start tracking my trades by saving pics, explaining if im long or shot and why, and anyone who wants can feel free to give CONSTRUCTIVE criticism. It's fine to disagree w/ me or even rail on me a bit, just don't be rude about it please.
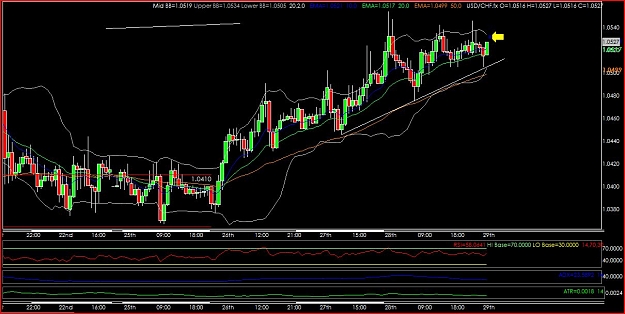
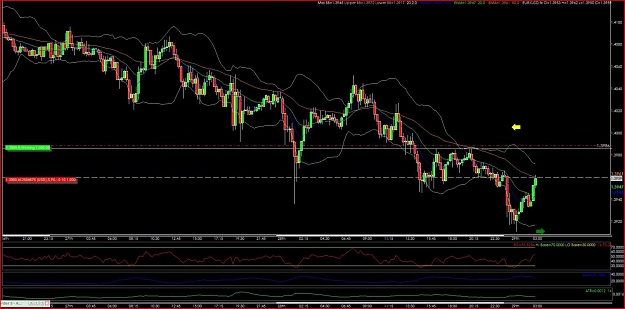
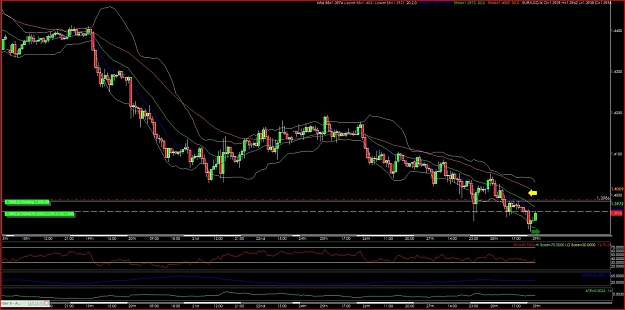
1. I'm going to be using hourly and 15 minute charts for my trades
2. I'll post my thoughts, write things on the graph etc.
3. Nothing fancy...
4. Many trades I'm going to take in this demo account are going to be bad trades...I'm just trying to get a better understanding of the market so I will be doing some stupid things but thats fine w me
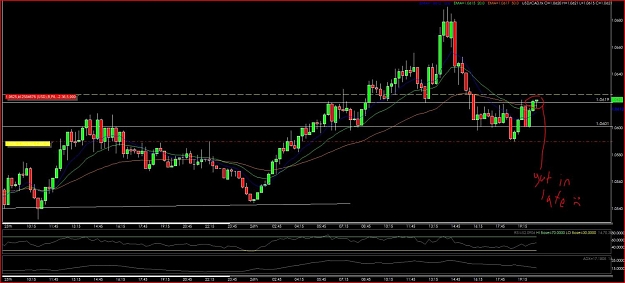
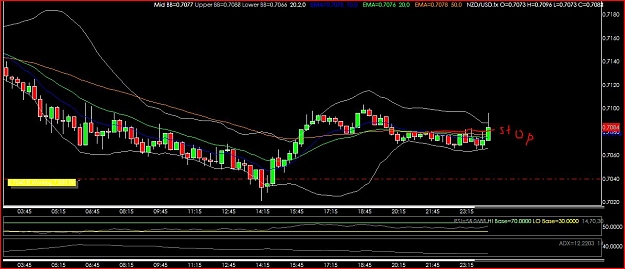
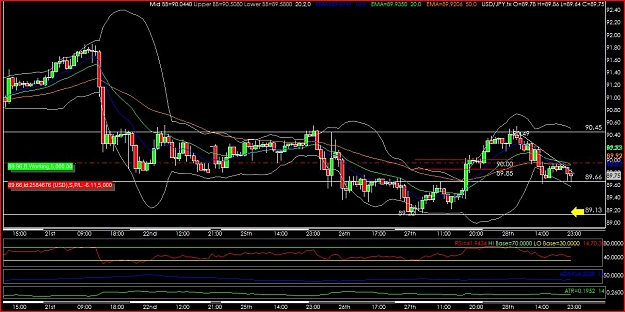
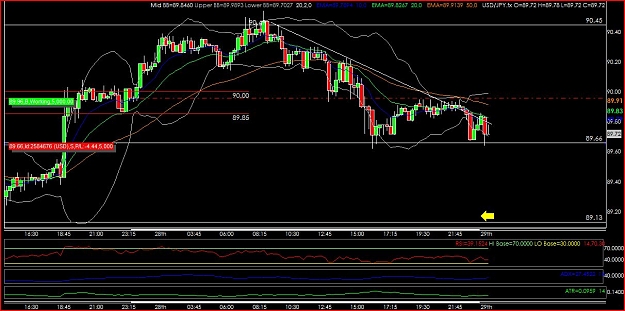
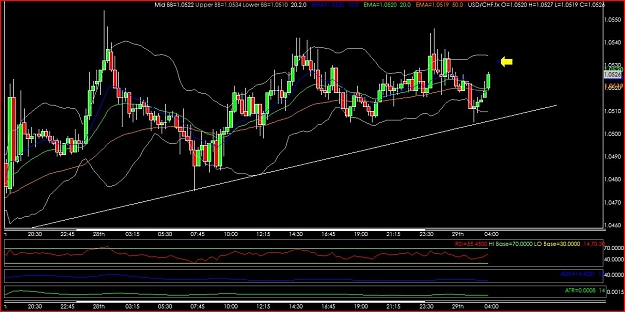
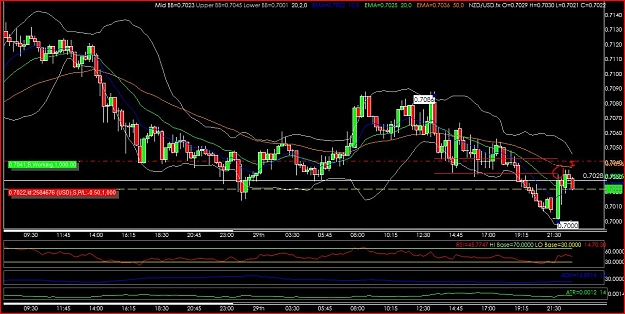
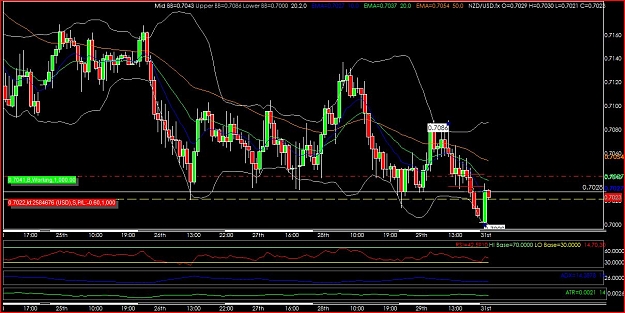
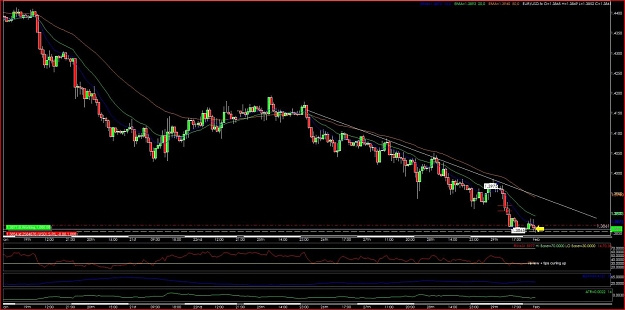
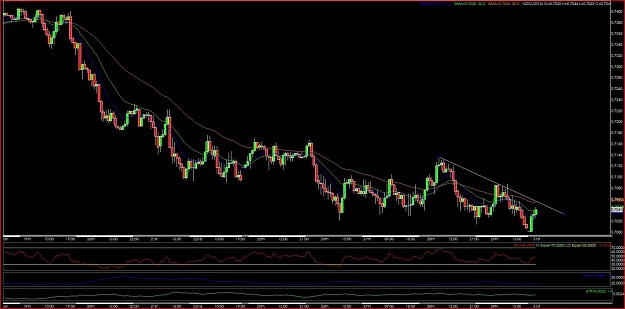
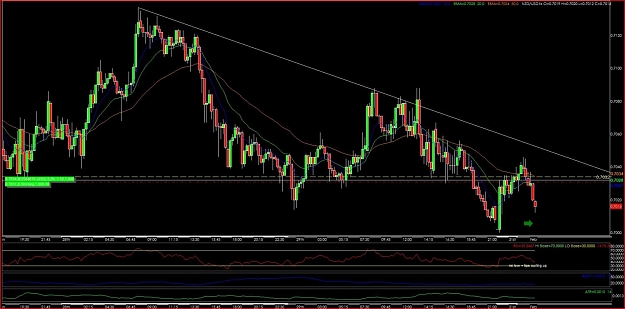
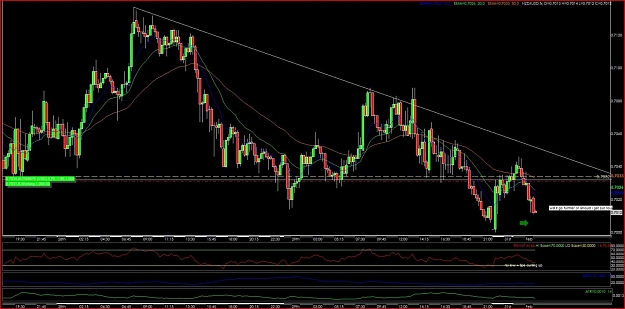
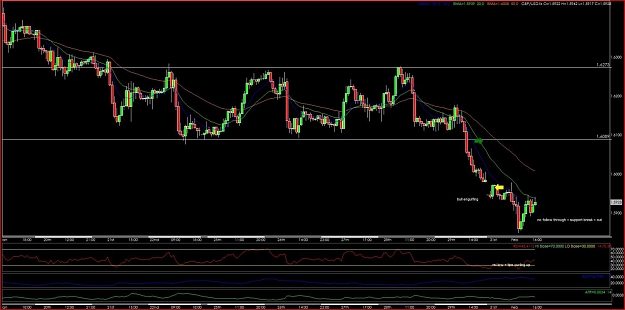
nzd/usd - short
So... the one hour chart and hte 15 minute chart are attached
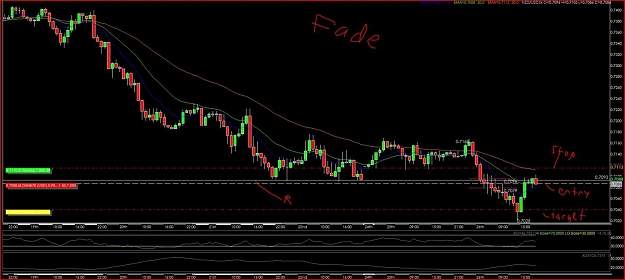
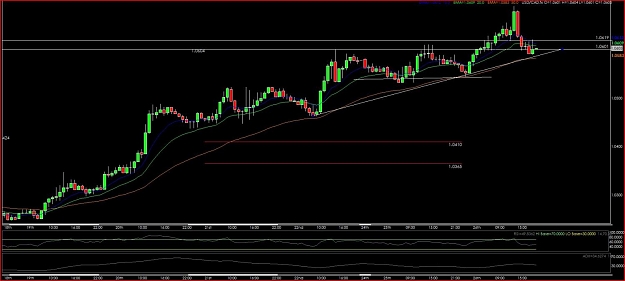
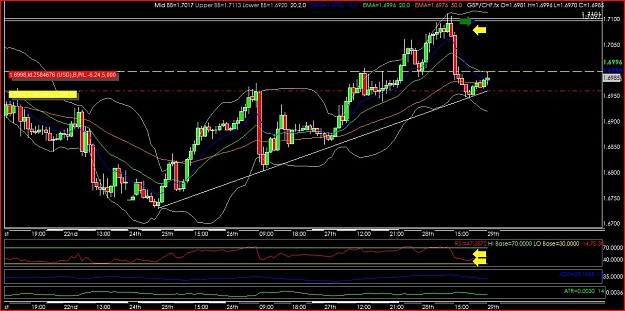
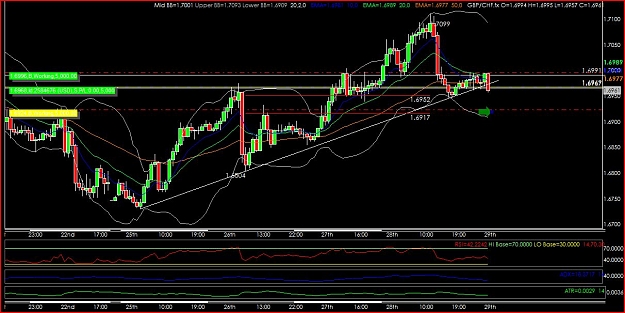
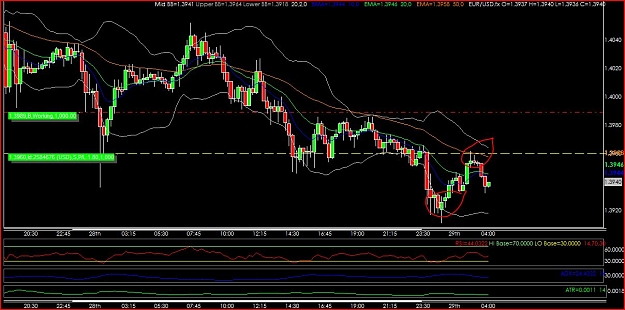
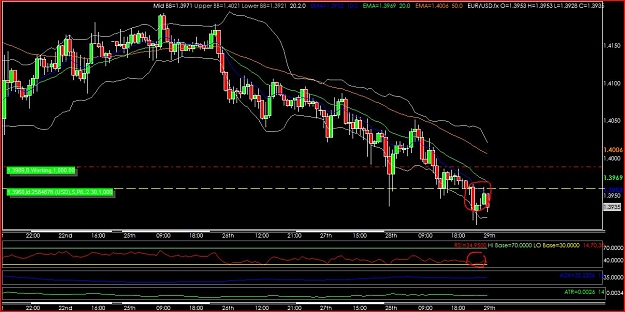
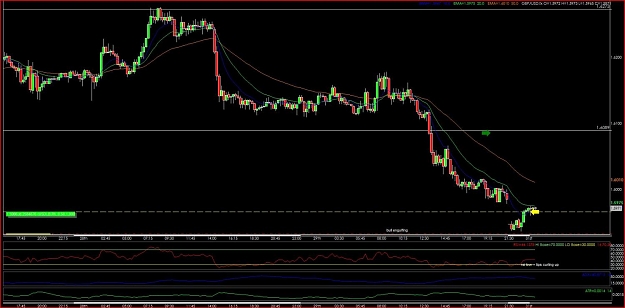
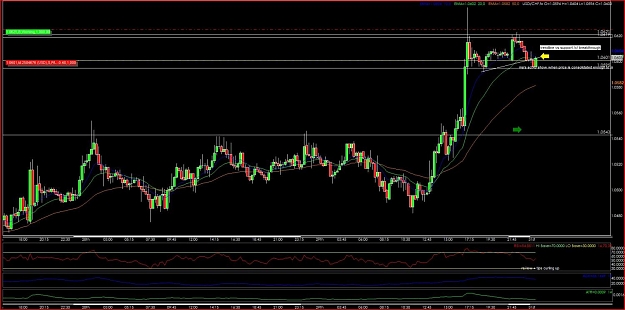
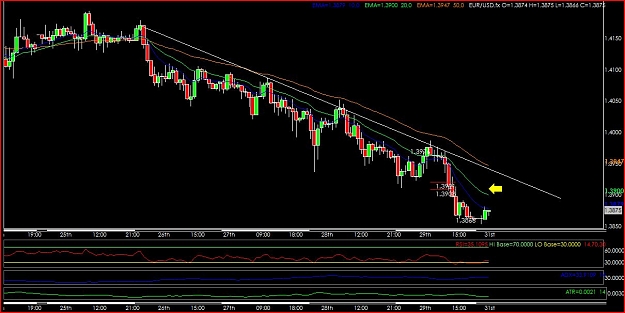
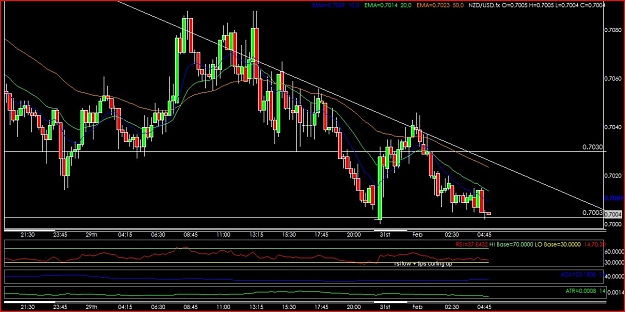
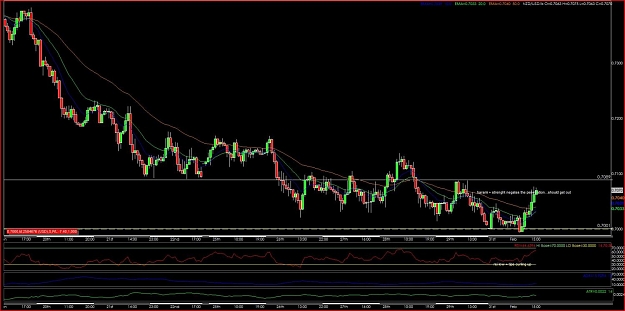
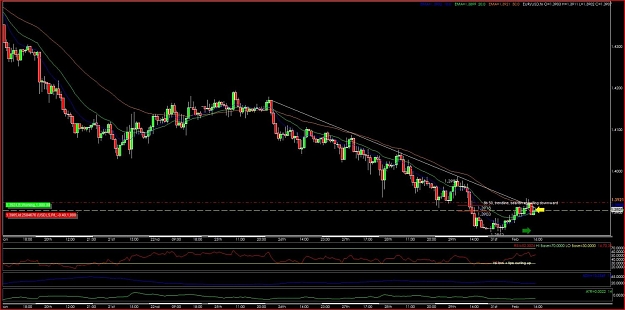
Hourly chart - The overall trend is downwards and price retraces to the 50% fibonacci level, also a resistance level. Rally was strong, so this could be good or bad: good because overbought, bad because that shows strength
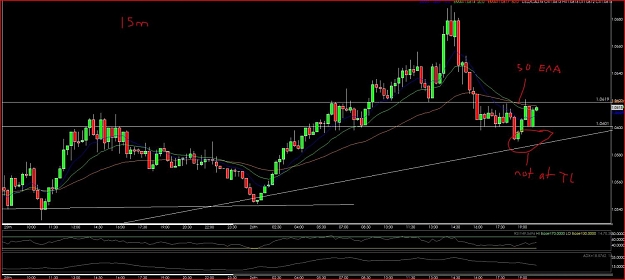
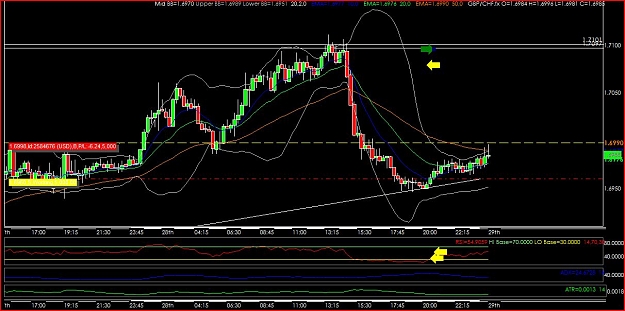
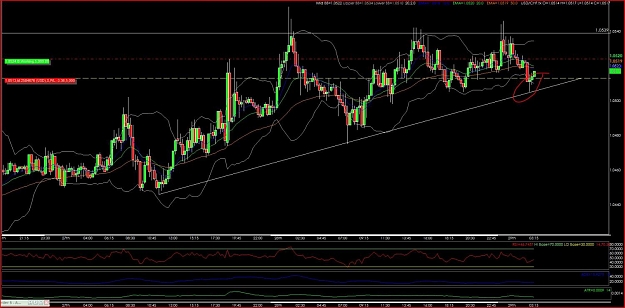
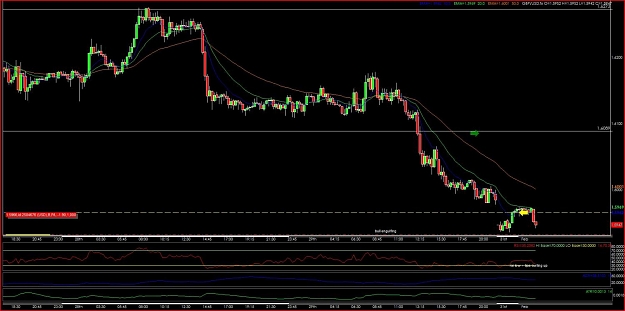
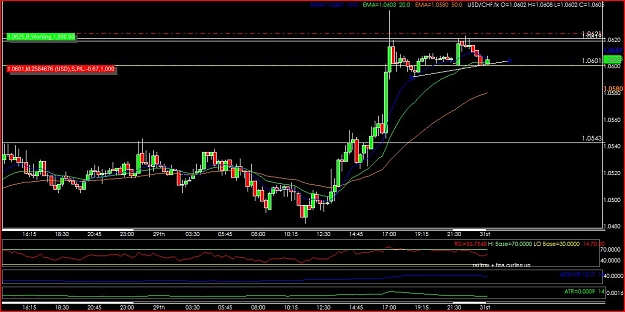
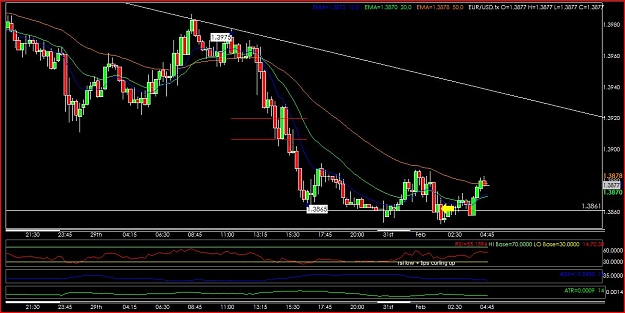
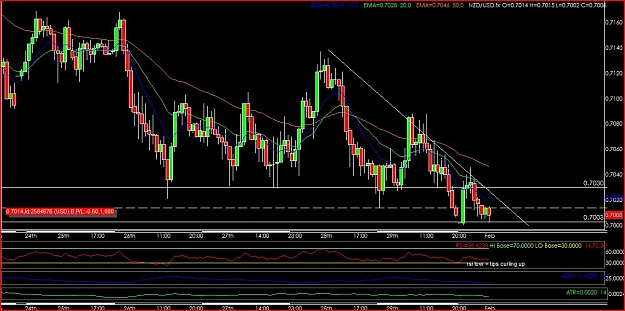
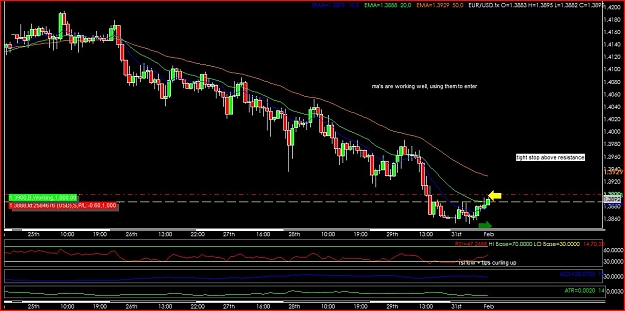
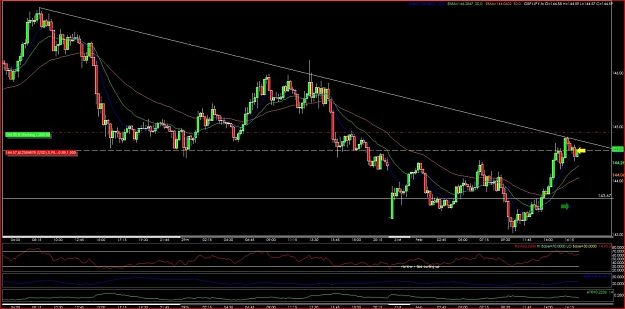
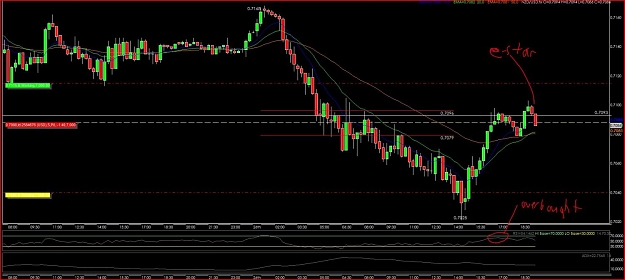
15 min chart - entry is based on evening star pattern and rsi close to overbought.
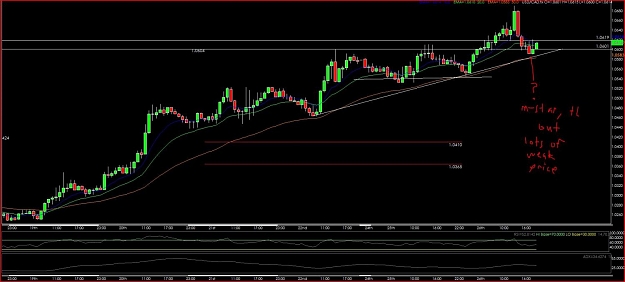
In retrospect I think I should have made the stop tighter: after-all, if the resistance breaks it means I was probably wrong about the downtrend continuing.
edit: the fibonacci lines are those little red ones you can see right near the entry
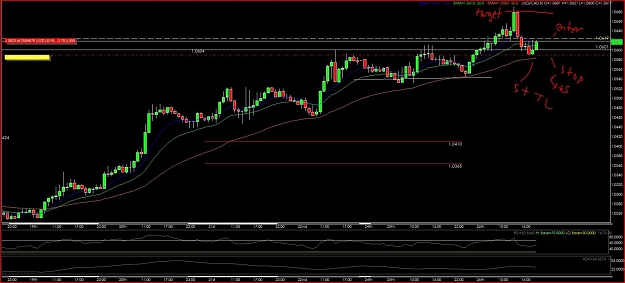
edit: I'm actually moving the stop loss closer to the entry point because of the reason above...don't usually do that but it was kind of a dumb stop in the first place. I'll still give room for some scary moves, but I'm tightening the stop:
1. I'm going to be using hourly and 15 minute charts for my trades
2. I'll post my thoughts, write things on the graph etc.
3. Nothing fancy...
4. Many trades I'm going to take in this demo account are going to be bad trades...I'm just trying to get a better understanding of the market so I will be doing some stupid things but thats fine w me
nzd/usd - short
So... the one hour chart and hte 15 minute chart are attached
Attached Image (click to enlarge)
Attached Image (click to enlarge)
Hourly chart - The overall trend is downwards and price retraces to the 50% fibonacci level, also a resistance level. Rally was strong, so this could be good or bad: good because overbought, bad because that shows strength
15 min chart - entry is based on evening star pattern and rsi close to overbought.
In retrospect I think I should have made the stop tighter: after-all, if the resistance breaks it means I was probably wrong about the downtrend continuing.
edit: the fibonacci lines are those little red ones you can see right near the entry
edit: I'm actually moving the stop loss closer to the entry point because of the reason above...don't usually do that but it was kind of a dumb stop in the first place. I'll still give room for some scary moves, but I'm tightening the stop: