I've been long enough being a stalker in FF with no contribute, yet I've learn so much from here. This will be my thanks to all of you good people in FF  . Very special thanks to (in no particular order) : Diallist, BK, Jacko, Merlin, James16, FXOpportunist, Accrete, Twinchell and many other (cant remember you all
 that willing to share your insight on this forum.
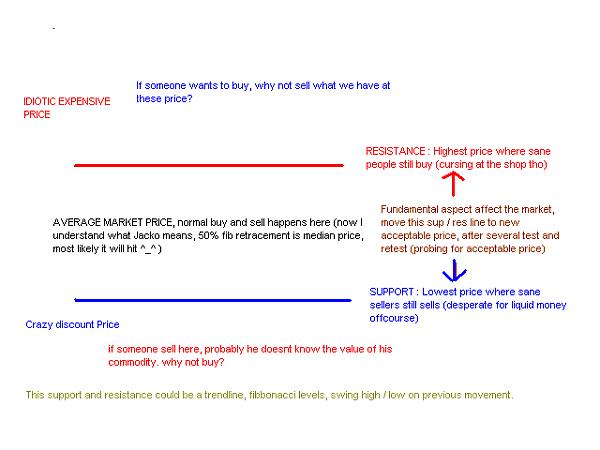
This method is completely mechanical. And it based on my manual price action method 'retest on support/resistance' entry, combined with cci50 for trend direction and pivot breakout for entry.
1. set 4h chart on GBP/USD and put in flippy indicator.
2. entry point :
Long entry -> Set buy stop on beginning of the day at current green line when :
- magenta lines is below green line
- blue lines is discontinued on the start of new day
or
- magenta lines is below green line
- red lines is NOT discontinued on the start of new day
Short entry -> Set sell stop on beginning of the day at current green line when :
- magenta lines is above green line
- red lines is discontinued on the start of new day
or
- magenta lines is above green line
- blue lines is NOT discontinued on the start of new day
Put 50 pips initial stoploss, and move initial stop loss to green line for existing position each new day.
3. exit point :
- let the stop loss hit
or
edit: - exit when magenta lines crossed with green line on beginning of the day, against the trend red/blue lines.
or
- On long position, exit at beginning of the day when red line discontinued.
- On short position, exit at beginning of the day when blue line discontinued.
Thats it for the mechanical part of this method. This mechanical approach generated 4.8k gross pips gain and 1.1k gross pips loss (thats 4:1 on R/R ratio), and around 60% win trades. Max consecutive loss is 3. and max drawdown recorded is 150 pips
In backtest I use 1% equity risk on each trade on compounded equity. It results is 200% current balance value from core equity. You can change the equity risk on backtest worksheet. It'll recalculate automatically on summary.
There's other way to trade this method, more profitable entry. Sometime that indicator doesn't catch a possible new trend fast enough. Fortunately, by knowing price action on 1-3 days back, I can see that market is rolling over, or a bounce on sup/res happens. In that case, I enter at beginning of the next day, with 50 pips stop loss. To use this other way, I suggest only for experienced traders who recognize market condition. Ccould use jacko 'anti-hedging' too for this discretionary approach.
*notes :
- I think this indicator wont 'repaint' the past, but to be sure, I need someone with good knowledge of MQL programming to confirm. I'm not quite good at coding with MQL. (something wrong with this indicator, Rusty helping me with recoding this, while I need to investigate why it shows different value with existing cci indicator)
- The mechanical method may work on EUR/USD and USD CHF pair and dont work on USD/JPY. But I haven't backtest on those pair yet.
- For those who curious on why I use yesterday pivot, I'm trying to catch a pinbar and engulfing pattern using both yesterday close and yesterday pivot.
Note : hmm need to retest/remake indicator. (just realized that pivot is a SMA[1] applied to typical price lol) I'll look into this, and recheck result later. The concept stays the same which is to catch pinbar/retest that break prev line. See you around.
Aha! found the problem. I'll do recheck and retest. I'll remove this invalid indicator & backtest. Will replace it later when finished.
January 2006 till now backtest, and indicator attached.