Hi coders,
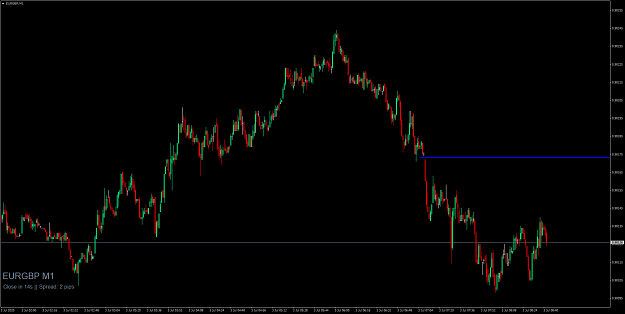
Please is anybody aware of an existing indicator to draw a line (ray) where there is a gap on 1 minute chart? An example attached is showing what I mean. There is a 0.1 pip gap between the 2 candles so I drew that blue line manually. Is there an indicator to do that? I found few indicators working with gaps, one of them is putting an arrow where the gap is but nothing seems to be catching small gaps with a line indefinitely extended into the future.
Maybe someone could code it? Hopefully it is not very difficult.
The only variables I can think of are the size of the minimum gap and the color and type of a line. The option of removing that line after the gap is closed would be great if it is possible.
Thanks.
Attached Image (click to enlarge)