TAS Forex Strategy Explained
Some of you will read this and some of you will not, Some of you will make money and some of you will not.
How i run through a trade setup, In my brain it takes a few minutes, But in writing it takes a lot longer to explain, so do not be put off by the following as i am cramming minutes into many words.
1. First Things First
First of all my name is Paul, i am from the United Kingdom and have now been studying Forex trading for the past 7 years starting of with binary options for 3 years before transferring to Forex and spending many years in dispair, I have tried 1000’s of indicators and strategies from all over the web until i came back to some basic free indicators and created this strategy.
I am only looking at the best possible place to enter a trade long or short based on the current market conditions of the currency pair, i call it “An Area of Value”. You cannot see these areas just buy looking at price itself easily so i have put together a trading system which gives me a clear indication of when price is out of sync with the market.
These areas provide the most profiable trading opportunities,as when the big players are looking to place their orders, wether its a change in direction or defending/building on orders already executed, they will always be looking for the best possible value in the given timeframe.
My Trading system is very, very simple to use and i believe it to be like no other i have seen anywhere so far, I am excited to be sharing this system with yourselves and im sure you will be very suprised at your trading results and the trading system itself.
OK in my next section i will move on to how to get the best value from a currency pair as i have not seen anything online which covers this properly, only half hearted attempts by part timers copying other part timers posts.
2. Currency Value
Not all currency pairs are equal, some move faster than others and also have a different value per pip.
So lets look at movement of currencies compared to each other, The majority of “retail traders” probably ignore this most of the time.
*This next bit is especially important to my strategy in particular as i use Round Numbers for entry and exits
Ok so lets compare two currency pairs with the same value per pip of £1 with an equal stake of £1 and my profit goal is £100 per trade.
Currency pair (A) moves on average 30 pips per hour and Currecy pair (B) 15 pips per hour on average. This is called an ATR ( Average True Range ) of a currency pair, So to reach my take profit goal of £100 per trade i would need 100 pips. But for Currency pair (A) i can roughly assume it will be reached 2 times times faster than Currency pair (B), Time is money, Why would i want to be stuck in a trade 2 times longer for the same profit so i adjust my TP, Stake and Risk as follows.
*NOTE! I always keep to a minimum 2:1 Risk reward ratio
Currency pair (A): ATR = 30 pips per hour
Pip Value = £1.00
Stake = £1.00
TP = 100 pips
SL = 50 pips
TP x Stake = £100
Trade duration = 3.3 hours
Maximum Loss = £50
Currency pair (B): ATR = 15 pips per hour
Pip Value = £1.00
Stake = £2.00
TP = 50 pips
SL = 25 pips
TP x Stake = £100
Trade duration = 3.3 hours
Maximum Loss = £50
As you can see by adjusting these important variables we can equal out the different ATR values to our advantage.
Now it becomes a little more complex as not all currency pairs have the same pip value ( Something many articles choose to ignore on this subject ).
Scenario 2:
Using the same data as above but the value of a pip per £1 stake has changed as follows:
Currency pair (A) = £0.50 per pip
Currency pair (B) = £0.50 per pip
Currency pair (A): ATR = 30 pips per hour
Pip Value = £0.50
Stake = £2.00
TP = 100 pips
SL = 50 pips
TP x Stake = £100
Trade duration = 3.3 hours
Maximum Loss = £50
Currency pair (B): ATR = 15 pips per hour
Pip Value = £0.50
Stake = £4.00
TP = 50 pips
SL = 25 pips
TP x Stake = £100
Trade duration = 3.3 hours
Maximum Loss = £50
As you can clearly see even though the currency pairs differ we have always kept the same Profit, Loss, Risk and Duration of each trade, So you are now able to adjust your trades in regard to the different currency price values and ATR’s and you can alter these to your liking in regards to the size of your trading account whilst keeping your account risk the same each time.
You may have to make slight adjustments as you go along as many pairs have different pip values and Average True Range , Take the time to do the maths and it will benefit you in the long run.
The great thing about this is you can adjust everything to suit the size of your trading account.
NOTE! I will be providing all indicators and template files i use later on.
3. Trading Tools
Even though these are placed into the MT4 indicators folder i consider them trading tools rather than indicators as they are implemented to give me an easier way to view and scroll through charts, See the pip value and the average true range of the currency pair.
*NOTE! These tools will be available in the download package later.
1) ATR Chart Labeled
This forex tool displays the current average true range and the previous average true range of the current chart currency pair and chart timeframe, i have set it based on a 200 past period to give me a clear picture on the average movement i can expect from each pair.
2) Pip Value Lite
A simple tool where you can see the value per pip of the currency pair you are currently viewing, You can adjust the lot size to suit your trading account but if your good at maths you can leave it at the default.
3) Pipsometer Decimal
Just a tool which will show your current trades plus or minus pips, making it handy for exits.
4) ACP Arrow Change Pair
Custom tool built by my friend Chris with a little input from myself, it places buttons on your chart where you can flick through currency pairs , also you can use keyboard arrow keys for scrolling which makes it even faster
5) ACP Multi Pair
A tool to complement “ACP Arrow Change Pair” , when ACP Arrow Change Pair is installed on chart one it will allow chart two to move on the same currency pair but in a different time frame ,,, very cool right
The more charts you add the more you can view simultaneously, it can do far more but we only need one or two TF on show depending on our preference to make money.
4. The Basics
1) I look at hourly charts for my overall view and entry points and 15 Minute charts to sometimes fine tune my trade entry points.
2) My trades can last from a few hours to days and sometimes over a week depending on the market exit points.
3) I only use 2 types of technical signal indicators on my chart the others are tools.
4) I exit my trades based on what price and my indicators are showing and trailing.
5) The movement of my trades will vary depending on the range and volatilty of the currency pair.
6) I am happy to exit when my system is telling me to exit, even though i may miss out on extra pips.
7) There are many, many trade opportunities each week , also i do not try and imagine something is there when its not
5. Getting Started
Every morning the first thing i do is scan the charts on a zoomed out basis so i can eliminate any currency pairs which do not look suitable for any of my trade setups and also pick out the ones which looks like a trade is ready or could be formed throughout the coming day. I also re-scan throughout the day as price can change quickly.
NOTE: My signal indicators are not on the images below
So some of the things i look for are:
1) Has price been trending lower or higher.
2) Is price at high or low in ranging market
3) Is this currency pair showing no potential for my strategy and needs ignoring at the moment.
A simple scan of the market takes only a minute or two.
I use a custom built indicator which myself and my trading friend ( Chris ) coded and makes it easy to flick through all currency pairs in just a few seconds.
NOTE! I will be giving this away for free later
6. Signal Indicators
I use 3 indicators on my chart, two indicators are very basic free indicators found in the MT4 indicators folder and the third is just a magnifacation of price areas (Round Numbers), The latter is available in the mql5 market place free to download directly or you can download a similar indicator on the web.
NOTE: I will provide a round numbers indi in the strategy file later on.
1) Round Numbers Indicator
Im not going to go into detail of the why. how and what of this indicator, i use it on 1000 and 500 areas and also respect 750 and 250 areas, Combined with the rest of the system it becomes a pretty leathal combo and you can clearly see how price reacts around these numbers below. The more you look at the chart you will be able to see the 750’s and 250’s without cluttering you charts so i keep to just the wholes and halves.
2) OBV ( On Balance Volume )
This is the indicator i use to decide something is about to change in the market, its a leading indicator and predicts where price will go in the future before the move has happened rather than lagging indicators which eventually catch up with price such as the many indicators based on the moving average basis, with this indicator price needs to catch up with OBV, this is wher our imbalance comes in.
3) Moving Average
The indicator where nearly all other indicators are created and show pretty much the same thing if you trying to enter a trade, I have to admit i hated this indicator for years trying all types of numbers , some looked amazing on part of the chart and awful on the next part it drove me insane for years, it probably still would if not combined with the other 2 indicators lol. Im showing you a rubbish example of the moving average in the image below as i dont want to give the game away yet
In the next stage i will show you my entry strategy by combining the indicators together to create my trading system.
7. Strategy Explained and Entry Setups
Ok here is the bit you have all probably been waiting for, Hmmn you’ve all probably scrolled down the page and had a look before you read the rest anyway , Am i correct
So lets combine all the indis together to explain how this strategy works and show you a few setups, my entries will include imbalance and also confluence trades no two setup will be exactly the same as you go along but from this you see what to look for, so lets get going.
I will show you a few setups of the current market at the time of writing as i cannot stand people pushing their strats and showing entries from past data , whats the point of that.
As i said before i trade hourly charts so my setup is as follows:
SL = 100 pips
Tp = Opposite Divergence of OBV or SL hit in profit.
NOTE: I will add more about this in my trade management section later
1) Strategy Explained Via Indicators
I like to see how price reacts around the round numbers in combination with OBV (On Balance Volume), If OBV is unbalanced with price around these areas it means there is value to be found in an entry in any market condition, but we are looking for real value and looking at price with OBV and round numbers is not enough.
I love the 200 ema and also 200 sma as price reacts very well to these moving averages and its always been considered that when price is above the 200 moving averages we are bullish and when below we are bearish, but we get caught out by this so many times and im sure its the big Market Makers playing their little games with the retail traders, I also use 50 MA’s on the chart as well because this can keep you in a trade and also give strong signal that price is about to change.
Main Chart Window
So on my main chart i have the signal indicators as follows round numbers indicator set to the 1000 and 500 round numbers and both the 200 sma, 200 ema and 50 ema with close of price, i like to have both because price reacts off both the 200 MA’s as it gives me even more confidence with my trade entries , just for psychological reasons to be honest.
Separate Chart Window
In my sub chart i have OBV there are minimal options for this indicator and i have it at default setting, i am not going to explain how OBV is calculated or anything like that, if you want to know more about on balnce volume then google it.
This is where the magic happens as i now apply another 200 ema and 200 sma to the OBV in the separate chart window and this shows where the smart money is relative to my entry points, lets take a look.
Below is the stages of a trade setup
Price verses OBV against the Moving Averages.
The first thing i look for when setting my sights on a trade entry is price to be around the 200 moving averages and also what OBV is showing me around the 200 moving averages, as you can see below the smart money is below the moving averages and we do not even consider the fakeout bullish move trying to trap buyers and throwing them out of the market..
Price and OBV Local Divergence
There are 6 entry points above in our two boxes and we can easily enter all of them for profit without getting within 50 pips of our SL, this is more of a global divergence but we can confirm our entries even further with a local divergence as well as shown below;
I have removed the MA’s for a clearer picture
Round Number Price Reaction
If the setups above are not enough then consider the added round number for a more exact entry, in these trades shown you could enter multiple times like the BIG players offloading their massive orders, enter on the first signal and see the trade out or even wait for the local divergence if you have the patience , now that is something only you can decide as a trader.
Below is a zoomed in screenshot of the same trade setup just to show how powerful Round Nimbers are.
Trade Overview
Lets sum up this currency pairs trade opportunities with our 100 pip SL and multiple entries and exit on divergence or moving SL 100 pips at a time as of trade management which actually comes in the next section
We acually would have got hit out by our trailing stoploss on both trades here as no opposite OBV divergence occurred
If you would have taken all six entries then thats a total of around 2,600 pips
Im going to post a few images now of the current timeframe so you can test your eyes this is all current real time not getting data from last month etc so you can see relevant trades not like youtube crap lol, Next i move on to trade management and Exit so enjoy the images.
Next trade management and exits.
8. Exits and Management
Forced Exit Via SL
OK finishing off with a critical element to maximizing profits and staying in trades as long as possible, You have to give your trades the room to move without risking to much i like to give 100 pips SL and trailing SL on the higher ATR pairs moving to break even after 100 pips profit then moving it 50 pips at a time as it moves from each round number always keeping the 100 pip difference, on the lower atr pairs i will tend to move down to 75 pips and then 50 pips as ATR decreases, once trailing stop is hit obviously trade is finished.
Managed Exit Via OBV Divergence
This is a manual close of the trade when OBV shows divergence in the opposit direction of the trade around a round number as this is our signal to enter it is also our signal to exit so keep your eyse pealed on your trades to maximize the potential profit
https://technicalanalysisstrategy.co...it-800x369.png
This final part finishes how i trade the forex market, i will add the templates amd indicators later for you to use yourselves.
Please use indis and Template files from post
https://www.forexfactory.com/showthr...0#post13009420
So we all have the same view
Some of you will read this and some of you will not, Some of you will make money and some of you will not.
How i run through a trade setup, In my brain it takes a few minutes, But in writing it takes a lot longer to explain, so do not be put off by the following as i am cramming minutes into many words.
1. First Things First
First of all my name is Paul, i am from the United Kingdom and have now been studying Forex trading for the past 7 years starting of with binary options for 3 years before transferring to Forex and spending many years in dispair, I have tried 1000’s of indicators and strategies from all over the web until i came back to some basic free indicators and created this strategy.
I am only looking at the best possible place to enter a trade long or short based on the current market conditions of the currency pair, i call it “An Area of Value”. You cannot see these areas just buy looking at price itself easily so i have put together a trading system which gives me a clear indication of when price is out of sync with the market.
These areas provide the most profiable trading opportunities,as when the big players are looking to place their orders, wether its a change in direction or defending/building on orders already executed, they will always be looking for the best possible value in the given timeframe.
My Trading system is very, very simple to use and i believe it to be like no other i have seen anywhere so far, I am excited to be sharing this system with yourselves and im sure you will be very suprised at your trading results and the trading system itself.
OK in my next section i will move on to how to get the best value from a currency pair as i have not seen anything online which covers this properly, only half hearted attempts by part timers copying other part timers posts.
2. Currency Value
Not all currency pairs are equal, some move faster than others and also have a different value per pip.
So lets look at movement of currencies compared to each other, The majority of “retail traders” probably ignore this most of the time.
*This next bit is especially important to my strategy in particular as i use Round Numbers for entry and exits
Ok so lets compare two currency pairs with the same value per pip of £1 with an equal stake of £1 and my profit goal is £100 per trade.
Currency pair (A) moves on average 30 pips per hour and Currecy pair (B) 15 pips per hour on average. This is called an ATR ( Average True Range ) of a currency pair, So to reach my take profit goal of £100 per trade i would need 100 pips. But for Currency pair (A) i can roughly assume it will be reached 2 times times faster than Currency pair (B), Time is money, Why would i want to be stuck in a trade 2 times longer for the same profit so i adjust my TP, Stake and Risk as follows.
*NOTE! I always keep to a minimum 2:1 Risk reward ratio
Currency pair (A): ATR = 30 pips per hour
Pip Value = £1.00
Stake = £1.00
TP = 100 pips
SL = 50 pips
TP x Stake = £100
Trade duration = 3.3 hours
Maximum Loss = £50
Currency pair (B): ATR = 15 pips per hour
Pip Value = £1.00
Stake = £2.00
TP = 50 pips
SL = 25 pips
TP x Stake = £100
Trade duration = 3.3 hours
Maximum Loss = £50
As you can see by adjusting these important variables we can equal out the different ATR values to our advantage.
Now it becomes a little more complex as not all currency pairs have the same pip value ( Something many articles choose to ignore on this subject ).
Scenario 2:
Using the same data as above but the value of a pip per £1 stake has changed as follows:
Currency pair (A) = £0.50 per pip
Currency pair (B) = £0.50 per pip
Currency pair (A): ATR = 30 pips per hour
Pip Value = £0.50
Stake = £2.00
TP = 100 pips
SL = 50 pips
TP x Stake = £100
Trade duration = 3.3 hours
Maximum Loss = £50
Currency pair (B): ATR = 15 pips per hour
Pip Value = £0.50
Stake = £4.00
TP = 50 pips
SL = 25 pips
TP x Stake = £100
Trade duration = 3.3 hours
Maximum Loss = £50
As you can clearly see even though the currency pairs differ we have always kept the same Profit, Loss, Risk and Duration of each trade, So you are now able to adjust your trades in regard to the different currency price values and ATR’s and you can alter these to your liking in regards to the size of your trading account whilst keeping your account risk the same each time.
You may have to make slight adjustments as you go along as many pairs have different pip values and Average True Range , Take the time to do the maths and it will benefit you in the long run.
The great thing about this is you can adjust everything to suit the size of your trading account.
NOTE! I will be providing all indicators and template files i use later on.
3. Trading Tools
Even though these are placed into the MT4 indicators folder i consider them trading tools rather than indicators as they are implemented to give me an easier way to view and scroll through charts, See the pip value and the average true range of the currency pair.
*NOTE! These tools will be available in the download package later.
1) ATR Chart Labeled
This forex tool displays the current average true range and the previous average true range of the current chart currency pair and chart timeframe, i have set it based on a 200 past period to give me a clear picture on the average movement i can expect from each pair.
2) Pip Value Lite
A simple tool where you can see the value per pip of the currency pair you are currently viewing, You can adjust the lot size to suit your trading account but if your good at maths you can leave it at the default.
3) Pipsometer Decimal
Just a tool which will show your current trades plus or minus pips, making it handy for exits.
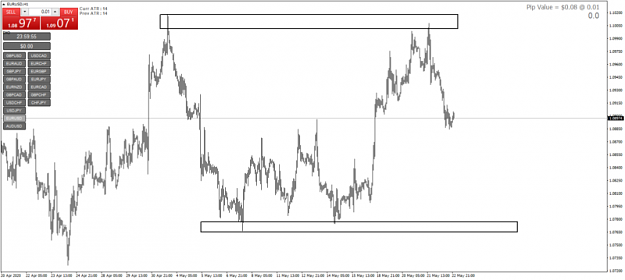
4) ACP Arrow Change Pair
Custom tool built by my friend Chris with a little input from myself, it places buttons on your chart where you can flick through currency pairs , also you can use keyboard arrow keys for scrolling which makes it even faster
5) ACP Multi Pair
A tool to complement “ACP Arrow Change Pair” , when ACP Arrow Change Pair is installed on chart one it will allow chart two to move on the same currency pair but in a different time frame ,,, very cool right
Attached Image (click to enlarge)
The more charts you add the more you can view simultaneously, it can do far more but we only need one or two TF on show depending on our preference to make money.
4. The Basics
1) I look at hourly charts for my overall view and entry points and 15 Minute charts to sometimes fine tune my trade entry points.
2) My trades can last from a few hours to days and sometimes over a week depending on the market exit points.
3) I only use 2 types of technical signal indicators on my chart the others are tools.
4) I exit my trades based on what price and my indicators are showing and trailing.
5) The movement of my trades will vary depending on the range and volatilty of the currency pair.
6) I am happy to exit when my system is telling me to exit, even though i may miss out on extra pips.
7) There are many, many trade opportunities each week , also i do not try and imagine something is there when its not
5. Getting Started
Every morning the first thing i do is scan the charts on a zoomed out basis so i can eliminate any currency pairs which do not look suitable for any of my trade setups and also pick out the ones which looks like a trade is ready or could be formed throughout the coming day. I also re-scan throughout the day as price can change quickly.
NOTE: My signal indicators are not on the images below
So some of the things i look for are:
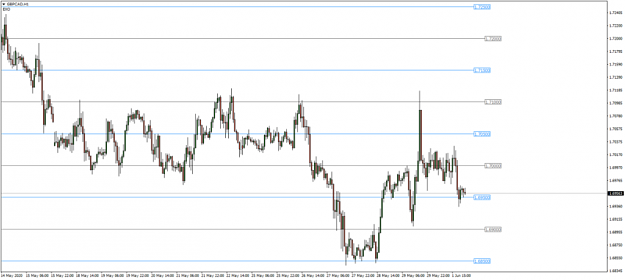
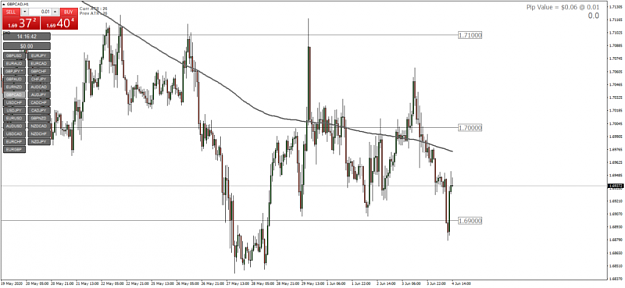
1) Has price been trending lower or higher.
Attached Image (click to enlarge)
2) Is price at high or low in ranging market
Attached Image (click to enlarge)
3) Is this currency pair showing no potential for my strategy and needs ignoring at the moment.
Attached Image (click to enlarge)
A simple scan of the market takes only a minute or two.
I use a custom built indicator which myself and my trading friend ( Chris ) coded and makes it easy to flick through all currency pairs in just a few seconds.
NOTE! I will be giving this away for free later
6. Signal Indicators
I use 3 indicators on my chart, two indicators are very basic free indicators found in the MT4 indicators folder and the third is just a magnifacation of price areas (Round Numbers), The latter is available in the mql5 market place free to download directly or you can download a similar indicator on the web.
NOTE: I will provide a round numbers indi in the strategy file later on.
1) Round Numbers Indicator
Im not going to go into detail of the why. how and what of this indicator, i use it on 1000 and 500 areas and also respect 750 and 250 areas, Combined with the rest of the system it becomes a pretty leathal combo and you can clearly see how price reacts around these numbers below. The more you look at the chart you will be able to see the 750’s and 250’s without cluttering you charts so i keep to just the wholes and halves.
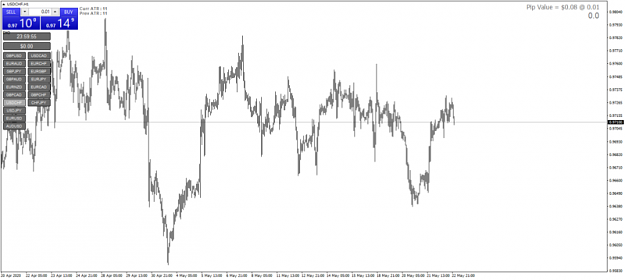
2) OBV ( On Balance Volume )
This is the indicator i use to decide something is about to change in the market, its a leading indicator and predicts where price will go in the future before the move has happened rather than lagging indicators which eventually catch up with price such as the many indicators based on the moving average basis, with this indicator price needs to catch up with OBV, this is wher our imbalance comes in.
Attached Image (click to enlarge)
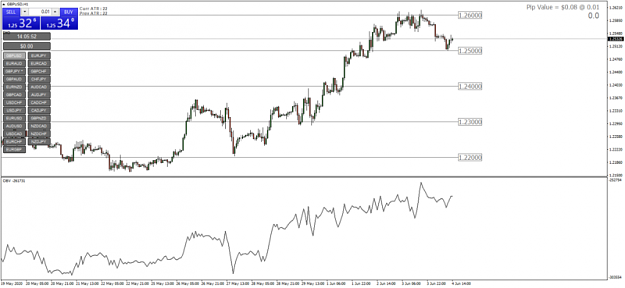
3) Moving Average
The indicator where nearly all other indicators are created and show pretty much the same thing if you trying to enter a trade, I have to admit i hated this indicator for years trying all types of numbers , some looked amazing on part of the chart and awful on the next part it drove me insane for years, it probably still would if not combined with the other 2 indicators lol. Im showing you a rubbish example of the moving average in the image below as i dont want to give the game away yet
Attached Image (click to enlarge)
In the next stage i will show you my entry strategy by combining the indicators together to create my trading system.
7. Strategy Explained and Entry Setups
Ok here is the bit you have all probably been waiting for, Hmmn you’ve all probably scrolled down the page and had a look before you read the rest anyway , Am i correct
So lets combine all the indis together to explain how this strategy works and show you a few setups, my entries will include imbalance and also confluence trades no two setup will be exactly the same as you go along but from this you see what to look for, so lets get going.
I will show you a few setups of the current market at the time of writing as i cannot stand people pushing their strats and showing entries from past data , whats the point of that.
As i said before i trade hourly charts so my setup is as follows:
SL = 100 pips
Tp = Opposite Divergence of OBV or SL hit in profit.
NOTE: I will add more about this in my trade management section later
1) Strategy Explained Via Indicators
I like to see how price reacts around the round numbers in combination with OBV (On Balance Volume), If OBV is unbalanced with price around these areas it means there is value to be found in an entry in any market condition, but we are looking for real value and looking at price with OBV and round numbers is not enough.
I love the 200 ema and also 200 sma as price reacts very well to these moving averages and its always been considered that when price is above the 200 moving averages we are bullish and when below we are bearish, but we get caught out by this so many times and im sure its the big Market Makers playing their little games with the retail traders, I also use 50 MA’s on the chart as well because this can keep you in a trade and also give strong signal that price is about to change.
Main Chart Window
So on my main chart i have the signal indicators as follows round numbers indicator set to the 1000 and 500 round numbers and both the 200 sma, 200 ema and 50 ema with close of price, i like to have both because price reacts off both the 200 MA’s as it gives me even more confidence with my trade entries , just for psychological reasons to be honest.
Separate Chart Window
In my sub chart i have OBV there are minimal options for this indicator and i have it at default setting, i am not going to explain how OBV is calculated or anything like that, if you want to know more about on balnce volume then google it.
This is where the magic happens as i now apply another 200 ema and 200 sma to the OBV in the separate chart window and this shows where the smart money is relative to my entry points, lets take a look.
Below is the stages of a trade setup
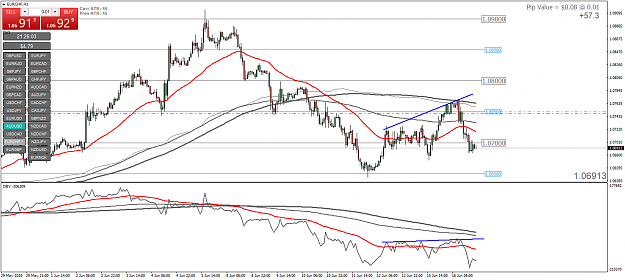
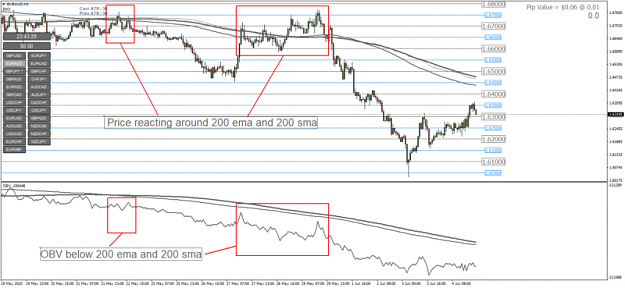
Price verses OBV against the Moving Averages.
The first thing i look for when setting my sights on a trade entry is price to be around the 200 moving averages and also what OBV is showing me around the 200 moving averages, as you can see below the smart money is below the moving averages and we do not even consider the fakeout bullish move trying to trap buyers and throwing them out of the market..
Attached Image (click to enlarge)
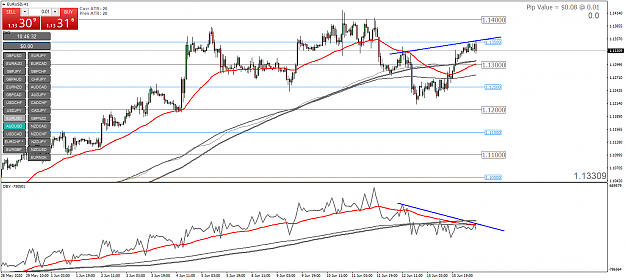
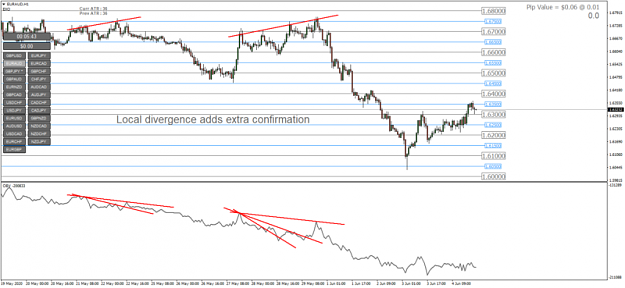
Price and OBV Local Divergence
There are 6 entry points above in our two boxes and we can easily enter all of them for profit without getting within 50 pips of our SL, this is more of a global divergence but we can confirm our entries even further with a local divergence as well as shown below;
I have removed the MA’s for a clearer picture
Attached Image (click to enlarge)
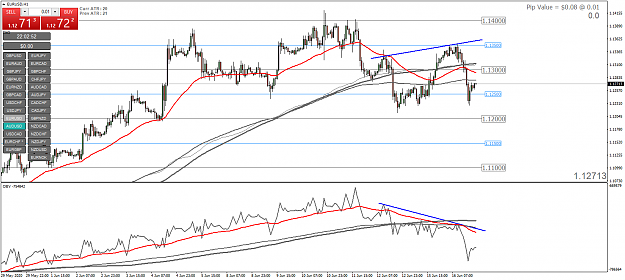
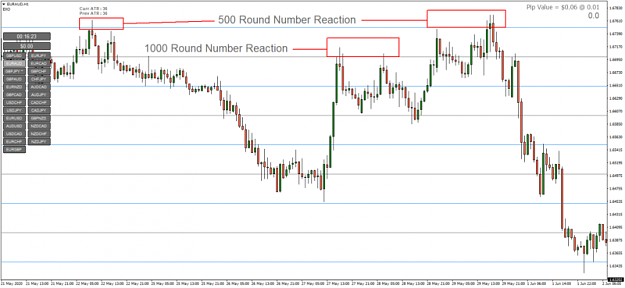
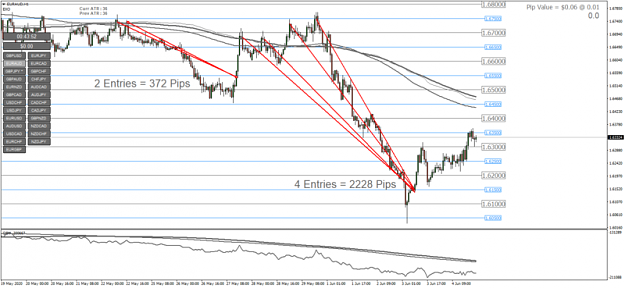
Round Number Price Reaction
If the setups above are not enough then consider the added round number for a more exact entry, in these trades shown you could enter multiple times like the BIG players offloading their massive orders, enter on the first signal and see the trade out or even wait for the local divergence if you have the patience , now that is something only you can decide as a trader.
Below is a zoomed in screenshot of the same trade setup just to show how powerful Round Nimbers are.
Attached Image (click to enlarge)
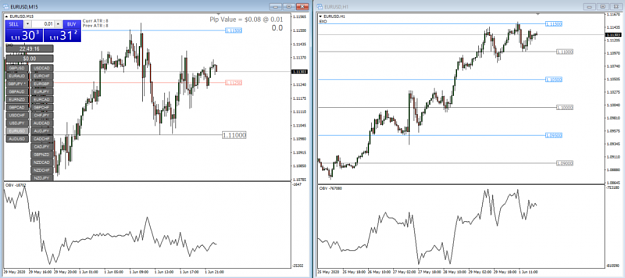
Trade Overview
Lets sum up this currency pairs trade opportunities with our 100 pip SL and multiple entries and exit on divergence or moving SL 100 pips at a time as of trade management which actually comes in the next section
We acually would have got hit out by our trailing stoploss on both trades here as no opposite OBV divergence occurred
If you would have taken all six entries then thats a total of around 2,600 pips
Attached Image (click to enlarge)
Im going to post a few images now of the current timeframe so you can test your eyes this is all current real time not getting data from last month etc so you can see relevant trades not like youtube crap lol, Next i move on to trade management and Exit so enjoy the images.
Next trade management and exits.
8. Exits and Management
Forced Exit Via SL
OK finishing off with a critical element to maximizing profits and staying in trades as long as possible, You have to give your trades the room to move without risking to much i like to give 100 pips SL and trailing SL on the higher ATR pairs moving to break even after 100 pips profit then moving it 50 pips at a time as it moves from each round number always keeping the 100 pip difference, on the lower atr pairs i will tend to move down to 75 pips and then 50 pips as ATR decreases, once trailing stop is hit obviously trade is finished.
Managed Exit Via OBV Divergence
This is a manual close of the trade when OBV shows divergence in the opposit direction of the trade around a round number as this is our signal to enter it is also our signal to exit so keep your eyse pealed on your trades to maximize the potential profit
https://technicalanalysisstrategy.co...it-800x369.png
This final part finishes how i trade the forex market, i will add the templates amd indicators later for you to use yourselves.
Please use indis and Template files from post
https://www.forexfactory.com/showthr...0#post13009420
So we all have the same view
On Point All Time Return:
na