Have a look at This post and that one, before you go further.
Hello and welcome to the thread. We will be learning how to perform proper Technical Analysis and trade the markets. I have recapped the information needed in short Youtube videos, as we will be basing our TA on 4 pillars, which are: Market Structure, Key Support/Resistance levels and Supply/Demand zones, Liquidity & Stops, and finally Fibonacci.
The dollar index is our barometer for risk, so to speak. Like I said, if the dollar is poised to rally, we are in a "Risk Off!" type of environment (pretty basic stuff). This should result in declines over EURUSD and GBPUSD. If the dollar is poised to decline, it's "Risk On!" and we can buy away euro & cable.
What this means is that we will have to start our analysis on a dollar index chart. Not many platforms have that, I am using a demo account on a broker for nothing but the USDX charts. I am not sure if I am allowed to refer people to it on here, so I will let you google it. USDx charts can be found on a number of web-based platforms too, I just find it handier that way.
How do we tell which direction the dollar is headed? By performing some tech analysis on a daily, H4 and even hourly chart, of course! The inverse correlation between EURUSD and USDx is the strongest, since the EUR amounts for the biggest part in the basket the index is made up of, but it goes for cable and other dollar based pairs just as well.
What do we look for? We look to spot KSR levels, sup/dem areas and the type of market environment the dollar is currently in.
I also use the dollar index to help me tell how far price may reach in the day, but that's a bit more complicated, so I will leave it with just a mention for now.
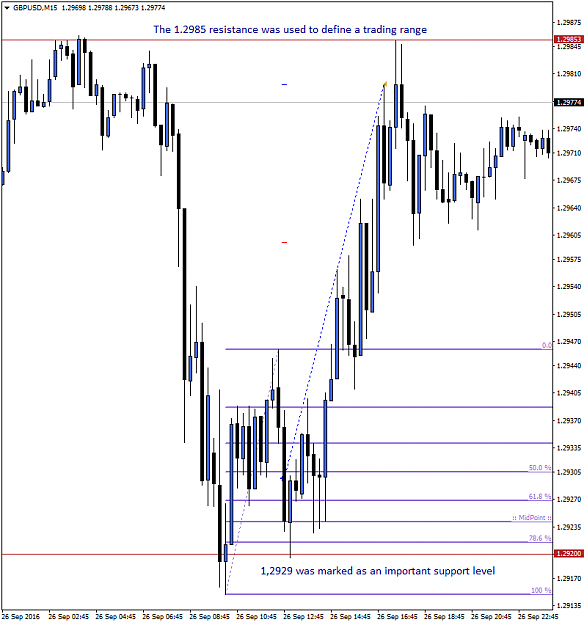
I will stop here for now, leaving off with a trade example from this week; a 50 pip winner from monday. The stop was initially a tiny 15 pip. This is a huge advantage to this system, we look for the most precise entries so that stops are no issue. My stop size usually varies, but is never more than 20 pips. The returns can be great.
edit: there is a small typo on the second text in the picture, it is supposed to say "1.2920 was marked as an important level", not 1.2929...
Nice thread WDays, sorry but I have to ask : Is this anyhow related to ICT ?
Ignored
As much as it is based on some of his concepts. I have adapted his stuff to suit myself as a trader. Like I said, I am very deeply influenced by ICT, even though I do not personally know him or have ever been in contact with him
Hello.
I also use what I learned from ICT's videos in my trading.
I used to follow him on Youtube but he is now doing mentoring and not posting any more. Such a shame!
It is obvious, from the last post, that some will not be reading the posts or the underlying concepts but will only want some-one to provide signals.
I trade the GBP/JPY, EUR/JPY and the USD/JPY as well as the one you mentioned.
Basically we're looking at naked chart trading, but instead of using classic price action patterns, candlestick patterns, inside bars, engulfing patterns and all that crap that works only when it does, we're basing our trades on predictive analysis. Contrary to popular belief, you CAN predict what price will do next.
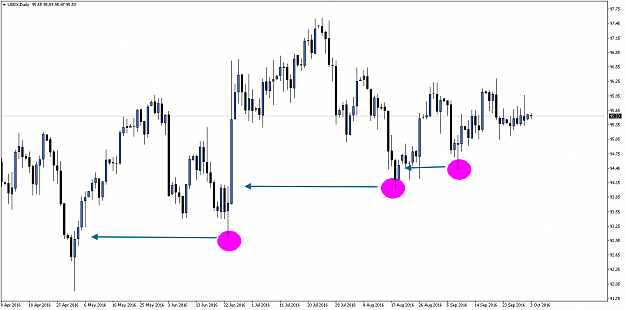
The idea is to show that there are signs of something being conjured up, and things happen for a reason on our charts. It is monday, so I am looking at a daily USDx chart.
Let's see if we can tell anything about these highlighted lows as they relate to prior market action...?
Hello. I also use what I learned from ICT's videos in my trading. I used to follow him on Youtube but he is now doing mentoring and not posting any more. Such a shame! It is obvious, from the last post, that some will not be reading the posts or the underlying concepts but will only want some-one to provide signals. I trade the GBP/JPY, EUR/JPY and the USD/JPY as well as the one you mentioned. Regards.
Ignored
Which is why I am trying to structure this thread more as a written guide rather than giving away my own interpretation.
ICT's stuff is gold, would be a shame if it all went to waste. I don't feel guilty when it comes to what I've done by opening this thread, because he used to encourage people who learned from him to "give back to the public" and since I have no intention of going commercial with this stuff, my conscious is clean
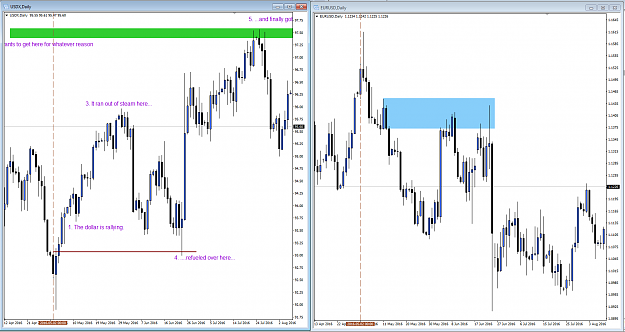
By using real-time charts that are based on the futures markets we can see the liquidity voids. MT4 charts of Futures markets tend to expand the candles to draw in these areas.
The $index began this week with a liquidity void. Looking at the G/$ we can see that the void has not yet been closed unlike the E/$. If we look at the Eur/Gbp we can see that the there is also a gap that has not been closed.
I like to use the Eur/Gbp as well to help make predictions.
Basically we're looking at naked chart trading, but instead of using classic price action patterns, candlestick patterns, inside bars, engulfing patterns and all that crap that works only when it does, we're basing our trades on predictive analysis. Contrary to popular belief, you CAN predict what price will do next. The idea is to show that there are signs of something being conjured up, and things happen for a reason on our charts. It is monday, so I am looking at a daily USDx chart. Let's see if we can tell anything about these highlighted lows...
Ignored
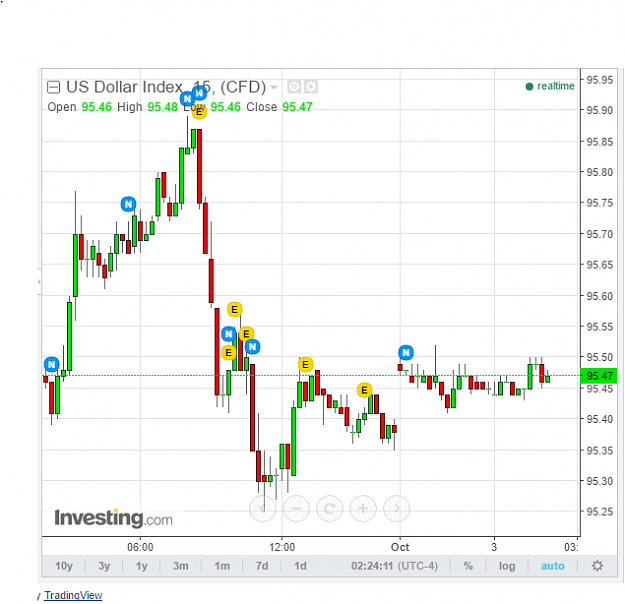
I have FXCM's USDollar index on one of my MT4 platforms, they are not my broker, and their candles/prices are different to yours. Mine doesn't show the nice incremental increase in price like your chart does. It is for this reason I also like to look at Tradingview charts or go to Investing.com for their chart.
{quote} Its developing a lower lows hence showing a bullish pattern. I also see a flag forming as well. Thats my observations
Ignored
Yep, good eye. It's making higher lows, which is supposed to be a sign of a bullish trend. But look closer - why did it drop and why did it stop where it did?
{quote} I have FXCM's USDollar index on one of my MT4 platforms, they are not my broker, and their candles/prices are different to yours. Mine doesn't show the nice incremental increase in price like your chart does. It is for this reason I also like to look at Tradingview charts or go to Investing.com for their chart.
Ignored
The charts that I use for USDx are forex ltd co uk. You can register a demo account and use the ones they provide on their metatrader.
{quote} Yep, good eye. It's making higher lows, which is supposed to be a sign of a bullish trend. But look closer - why did it drop and why did it stop where it did? The answer: magic! {image}
Ignored
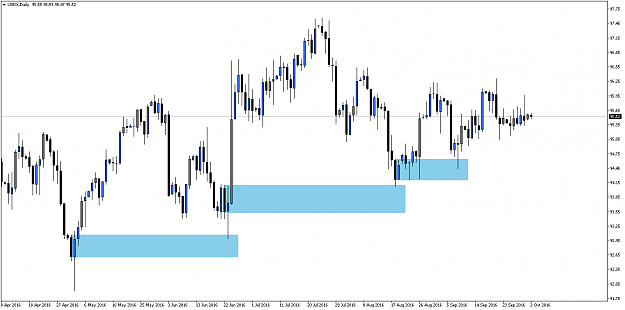
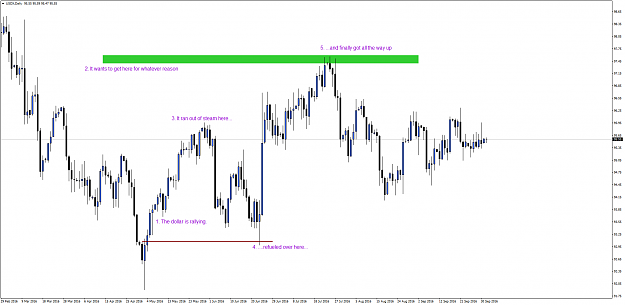
Think of those areas as demand. The reason markets can't just keep going straight in one direction is because they need fuel.
I look at things this way: The dollar started the rally roughly from 92.00; moved all the way to 95.95 and lost some of its steam. It then fell until it reached a stack of buyers piled up over at around 93.00 before thrusting up and reaching 97.55.
Markets are like a pendulum. They oscillate up and down. There is nothing random here.
{quote} Think of those areas as demand. The reason markets can't just keep going straight in one direction is because they need fuel. I look at things this way: The dollar started the rally roughly from 92.00; moved all the way to 95.95 and lost some of its steam. It then fell until it reached a stack of buyers piled up over at around 93.00 before thrusting up and reaching 97.55. Markets are like a pendulum. They oscillate up and down. There is nothing random here. {image}
Ignored
To put it in context, while the dollar is rallying, the euro and pound should be declining.