I decided to move this from the recycle bin, as it seems the threads there have a limited life, and I put a fair bit of work into this, hence I felt it was worth preserving. Hopefully it might prove to be interesting or useful to somebody.
I suppose I'll be accused of promoting the evil forex game, or posting for personal or commercial gain, but........
This is a rare post, as I no longer wish to be a regular contributor here.
Please feel welcome to download and use this FREE software. However, read the attached PDF first, as I won't be answering any more questions.
Latest release: 1.33, uploaded Aug 26, 2019. (If you want to keep up to date with the latest version, then please feel welcome to revisit this thread occasionally, as I don't intend to keep bumping it).
PDF file with all instructions. Download and read this first.  FF thread 915949 -- Plot long & short retail positions (from myfxbook) on MT4 chart.pdf
3.4 MB
|
4,016 downloads
|
Uploaded Aug 25, 2019 10:21pm
FF thread 915949 -- Plot long & short retail positions (from myfxbook) on MT4 chart.pdf
3.4 MB
|
4,016 downloads
|
Uploaded Aug 25, 2019 10:21pm
ZIP file with all necessary install files. See instructions in the 'Installation' section of the PDF.
Note: The zip file has been removed from Forex Factory, due to a virus warning from Windows 10 Defender. However, it checks out OK by both AVG and Kapersky labs, and I've been running it now for several months without any problems, causing me to believe that the Defender warning is a false postive. For anybody who is willing to take the risk, the zip file can now be downloaded from here.
Summary of major conclusions reached
1. Plots of retail volume flows and currency strength are almost the mirror image of each other, telling us that the majority of retail traders look to buy weakness and sell strength (aka "buy low, sell high"). Pair-based plots tend to confirm this, i.e. that while price is rising, sell volumes increase (and buy volumes decrease, thus buy orders are being closed in profit), and all of these operations continue when price consolidates following a rise; and the reverse applies in mirror image scenarios.
2. There is little that can be gleaned from the retail volume flow plots that one can't deduce by merely studying price. In fact the plots lag price somewhat, presumably because it takes retail traders time to react to price movement. (However, one benefit of the retail analysis is that it is timeframe independent, i.e. same value for all TFs, keeping analysis tidy and unambiguous).
3. According to general market theory, buying weakness and selling strength works well enough during sideways periods; P/L is determined by how accurately the trader is able to pick market tops and bottoms. Losses accumulate during periods when the market trends far enough, often enough. Conversely, allowing winners to run, and even adding to winners, works effectively to whatever extent price 'trends'.
4. The stats on the myfxbook outlook page show that the majority of retailers' open positions are under water, many significantly so. This suggests that (1) buying weakness and selling strength is, on balance, an inferior entry strategy; and/or (2) retail traders are leaving their losing trades open longer than their winners.
5. Read this.
Important note: When I use the term "current sentiment" or "prevailing sentiment" (e.g. in posts #21, #25, #26), I don't mean the SSI value (current net long/net short ratio), which is calculated from historical transactions that bring us up to the current point; instead I'm referring to the currently prevailing (collective bullish or bearish) mood that will have an impact on orders that will be placed henceforth. The SSI/volumes value lags the current mood, e.g. for it to move from 80% net long to 80% net short, a large volume of selling must occur (and hence the mood was actually bearish throughout that time).
To see the accompanying plots, and for more observations, read the PDF. And also this FF thread, where the underlying concepts are discussed in more detail (acknowledgements to neilsdigest, osjoe2, and various others for their contributions).
Replies to posts.....
I don't intend replying to any more questions. If you're experiencing problems with the software, please see the 'Troubleshooting' section in the PDF file. If you can't resolve your issue, there are plenty more third party MT4 indicators around for you to play with.
To those members who post(ed) kind comments, these are very much appreciated. Many thanks.
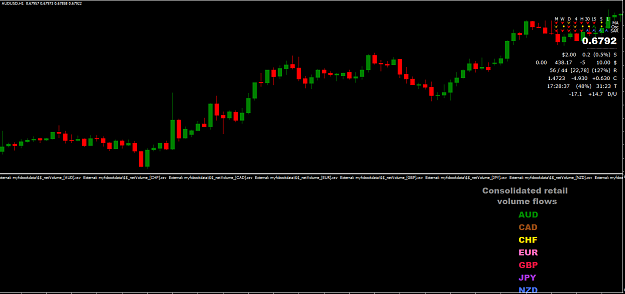
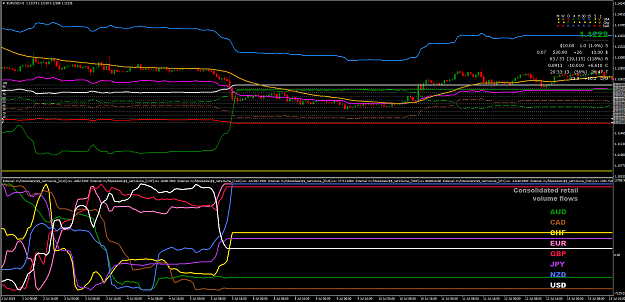
I've provided additional downloads and a MT4 template that will plot net volume flows summed across all pairs for the 8 major currencies, all of which is available in the initial release. There's a screenshot at the end of the 'Overview' section in the PDF above. Also, I've created a XLS which you can get from the Miscellaneous folder in the ZIP above. If you paste the summary csv file (generated by Download_myfxbook_outlook.exe) into the boxed section (cells M3...AD94) every time you need an update, the values for the 28 pairs are aggregated, and the %long average for each of the 8 major currencies is shown in cells A1...H2. Of course you can modify the XLS to suit your own specific requirements.
Thanks for alerting me to this. I will consider rewriting the app accordingly, when I get some spare time.
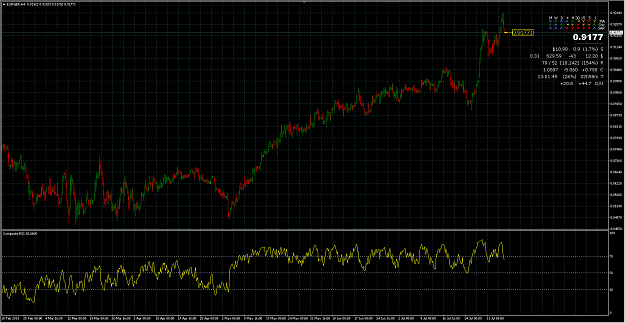
Good analysis imo. JPY can be tricky however, as it is sensitive to risk on/off which can change in a heartbeat. Occasionally get some good trends with JPY based pairs though.
I removed it temporarily while I fixed a small bug. The fixed version is available (above). To reinstall, when you are unzipping the files, make sure that you overwrite all previous files with the same names. Sorry for any inconvenience.
I assume that you're using the MT4 template(s) that I supplied? Anyway:
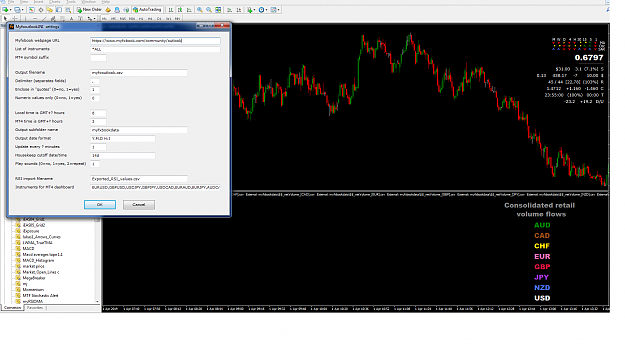
1. Check the settings in your ..../MQL4/Files/myfxoutlook.ini file**
Mine are as follows:
MyfxbookURL=https://www.myfxbook.com/community/outlook
Instruments=*ALL
MT4SymbolSuffix=
OutputFileName=myfxoutlook.csv
Delimiter=,
EncloseInQuotes=1
NumericValuesOnly=0
LocalTimeIsGMTplus=12
MT4TimeIsGMTplus=3
OutputSubfolder=myfxbookdata
OutputDateFormat=Y.M.D H:I
UpdateEveryXminutes=60
HousekeepCutoffDate=2019.06.01
PlaySounds=2
RSIimportFilename=Exported_RSI_values.csv
You need a non-blank and non-zero entries in the green highlighted settings respectively, if you want the timeseries plots on your MT4 charts.
You will need to get the timezone settings (highlighted in yellow) correct for your own location, and your MT4 broker's location., to get the plots to align correctly with the candles. See page 9 of the PDF for more info.
[** In case you're unsure how to edit the ini file:
i) If the myfxbook icon is showing in your systray, right click it and choose Exit, to exit the Download_myfxbook_outlook.exe app.
ii) Go to MT4. Use MT4 dropdown menu option Files -> Open Data Folder
iii) Double click on folder MQL4, and then folder Files
iv) Locate the myfxoutlook.ini file. Right click, and select open with Notepad.
v) Make the necessary changes to the green and yellow highlighted settings, as shown above.
vi) In Notepad, choose dropdown menu option Files -> Save, and then Files -> Exit.
vii) Now you should be back in Windows file manager, double click on the Download_myfxbook_outlook.exe app to re-launch it.
viii) Close Windows file manager, which should return you to MT4.
ix) If you haven't already done so, open a blank new chart, and apply the hanover_consolidated template.]
2. For more detailed instructions, please read the 'Troubleshooting' section on page 17 in the PDF.
3. Note that it might take up to 24 hours of collecting data (while the FX markets are open) before any meaningful trends are discernible.
Thanks for the screenshots, at least it gives me some idea as to locations of files, settings, etc. Everything looks fine to me. 
Make sure that you can see the little myfxbook icon in your systray, otherwise the download app isn't running, and no data will be collected.
The chart you're showing me is daily. Therefore you will need to gather data, using the new settings, for at least 2-3 days before anything will show on the chart.
Try a shorter TF, e.g. H1. Also if/while myfxbook window into the market is closed for the weekend, no data can be gathered.
Perhaps try setting UpdateEveryXminutes=15 for a while, so that the data files get updated every 15 minutes, instead of 60. Also if you set PlaySounds=2, your computer will give a small beep every time the data is updated.
Important: Try switching backwards and forwards between chart TFs, to force a refresh of all of the indicators.
One minor point, I expect your timezone settings are meant to be 5½ hours ahead of GMT, that is 5.5 hours, not 5.30 (entry should be hours, not hours and minutes)
Give it a day or two, then check that the csv files are starting to fill up with data. Don't leave the files open in Excel, though, because Excel locks the file and prevents any data from being added to it. Switch to a suitable TF chart and hopefully you'll start to see some data starting to emerge like the screenshots I took in the PDF.
Please read the PDF for more info. Everything you need to know is written there. I am just repeating myself.
There are no known bugs in the software, it is all working perfectly on my (Windows 7 64-bit) computer. We are both running the same software. Therefore there must be something different on your computer, but I can't possibly know what it is.
The calculation is performed over the 28 pairs involving the 8 major currencies (AUD,CAD,CHF,EUR,GBP,JPY,NZD,USD) only.
Note that, for the sake of efficiency, new values are appended to the files only if the currently scraped (or calculated) value differs from the last value in the file.
The net volumes where the currency is the first named in the pair are added, if the second named, they are subtracted.
Perhaps best explained by an example; I just took a snapshot of all of the NZD pairs, and their volumes (final value in each file) were as follows:
netVolume_[NZDCHF].csv: 1546.41
netVolume_[NZDUSD].csv: 4192.88
netVolume_[NZDJPY].csv: 2490.8
netVolume_[NZDCAD].csv: 1028.41
NET TOTAL where NZD is first named = 9258.5
netVolume_[GBPNZD].csv: 108.83
netVolume_[EURNZD].csv: -3205.07
netVolume_[AUDNZD].csv: 832.41
NET TOTAL where NZD is second named = -2263.83
TOTAL net volume for NZD = 9258.5 - (-2263.83) = 11522.33, which is in fact the final value in $$_netVolume_[NZD].csv
QED.
Of course there are many other possible approaches (at one point I considered weighting each value in various ways), but for better or worse, that is the calculation that I ended up using.
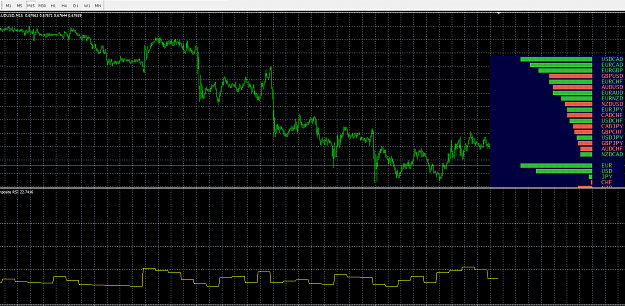
Note that each curve is INDIVIDUALLY scaled to fit inside the subwindow; therefore the actual values of each plot should not be compared against each other. It's the changes in slope that are important, showing the rate at which total net volume is advancing or declining for that currency. Ideally either (1) each currency should be plotted in its own subwindow (but this would consume too much screen space); or (2) if you want to compare the actual values, then go to the 'Common' tab and set the SAME 'Fixed minimum' and 'Fixed maximum' value for each of the 8 plots (however, this will make it harder to see the changes of slope in the smallest transacted currencies).
Your screenshot looks like a M1 chart with UpdateEveryXminutes=10, hence values get updated once every 10 candles, creating the 'stepwise' plot. So it looks ok to me. Most of my screenshots were created with UpdateEveryXminutes=15 or 60, and charts M15 or H1. The retail volumes data doesn't change significantly very often, hence I prefer to take a longer term view. It's useful for gaining overall direction, but not for scalping. Also, the shorter the update period, the more data MT4 will potentially have to deal with, slowing performance. Conversely, the longer the update period, the longer you'll have to wait to get a meaningful plot, so it's a case of being patient. The plots in some of my screenshots took 2-3 days to develop.
About making money: I'll tell you a story. I live in New Zealand. Back around 2012 I was invited to the trading floor of one of Australasia's biggest trading banks, and I also got to hear an address from their chief economist. She had a PhD, and had previously been chief economist for the RBNZ for many years. Her knowledge was totally awesome, she gave a brilliant 20-30 minute speech on the state of the world economy, and where she thought the NZD, USD, gold etc would go, short term and long term, along with all of the key drivers and reasons. The audience was spellbound. She asked if there were any questions; one gent was cheeky enough to ask her why she didn't leave her job and trade privately. I guess that everybody listening was wondering the same thing. Her reply was something like: "You mean like trade forex? Do you think I'm crazy? It's far too risky".
'Pause script' and 'Suspend hotkeys' are not my invention; they are functions built into autohotkey (the programming language that I used to create the exe). As far as I know, selecting 'Pause script' should pause the exe and suspend it from processing (hence no data will be written); the icon in the systray should change to a red box with a 'H' in it. Then click 'Pause script' again to restart the exe from exactly where it left off. (Hence it works much the same as the 'Enable/disable AutoTrading' icon on MT4's toolbar). Of course you could achieve much the same thing by clicking 'Exit', and then running the exe again. Note that if you want the exe to recognize any changes you've made in the settings ini, you must Exit, then change the settings, then run the exe again.
To output consolidated totals for anything other than the 8 major currencies, I would need to enhance the program code. I stopped at the 8 majors because data for all of the relevant 28 pairs was available, making it possible to sum volumes across exactly 7 pairs for each currency, allowing for an even-handed comparison (which is important for the $$_netCount[xxx].csv output). However, I'll give your idea some thought when I get some spare time.**
[EDIT] ** I've made the necessary enhancement, and uploaded the new version. Please read the final page of the PDF ('Version 1.23 release') for more info.
I'm not offering a programming service, free or paid, but I had a quick look at your request. The myfxbook API doesn't include the heatmap. So I attempted to scrape the data, but I couldn't find a way of choosing the instruments (like you can manually, using the dropdown on the webpage), and consequently got only the items shown below (supposedly their default set). There are many other CSMs/heatmaps available (see the links in the green typeface here). Or it wouldn't be too hard for somebody to code a MT4 indicator that outputs a CSV file containing pips or percent changed since the last candle, for any user-defined selection of available instruments/timeframes. If you can't find one, you could try posting in one of the "I code for free" threads. Good luck.
Please read both of my replies to maknil above, and then the 'Troubleshooting' section in the PDF.
I don't understand why you would want to run MT4 and the Download_myfxbook_outlook.exe app on different computers. As long as they are both running on the same computer there shouldn't be any gaps in the data. The download app runs quite happily and transparently in the background, as explained in the PDF.
If you do want to run both MT4 and the download app on separate computers for whatever reason, then you would need to find a programmer to write another app that also runs concurrently in the background, and transfers the necessary files between the two computers. I'm not currently in a position to do this.
If the myfxbook icon is showing in your systray, right click, and then click 'Exit' to close the Download_myfxbook_outlook.exe app.
Then re-run the app, and check that your settings are the same as mine: 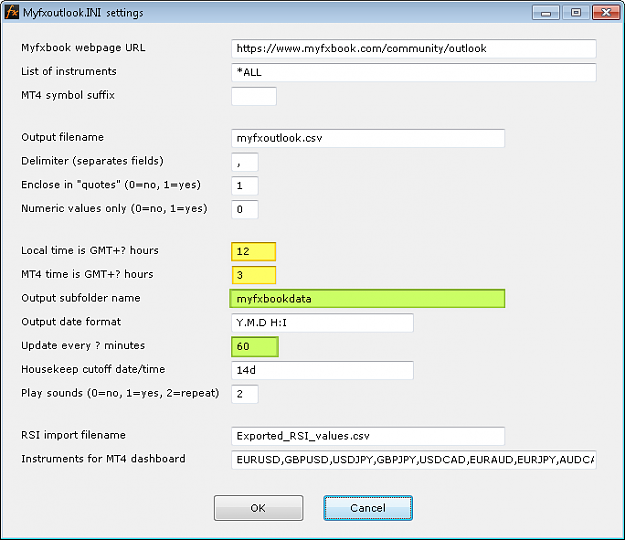
The items highlighted in green are crucial. [Also, please note that you'll need to get your timezone settings (yellow highlight) correct — more info on page 15 of the freshly uploaded PDF — if you want the timeseries to plot under the correct candles].
Note that it will take several hours for any meaningful trends to plot (with these settings it is loading only one datapoint every 60 minutes).
After that, try switching the chart to the next highest TF, and then back again. This forces a refresh of the chart.
Also, please read the comprehensive 'Troubleshooting' section starting on page 24 of the PDF. Good luck.
App needs to gather real time data (the myfxbook page doesn't include historical values), and (in the interests of efficiency) it imports timeseries data only if the value has changed since the last read. If the market is closed for the weekend, data does not change. Hence the app has probably captured only one data point, and it takes at least two points to plot a line. You could view the csv files in the ...../MQL4/Files/myfxbookdata folder and verify that they hold no more than one data point (i.e. row or line) each.
NOTE: By setting 'Update every ? minutes' to 1, you will be picking up virtually every change, hence the app will potentially gather vast amounts of data. In which case I would set the 'Housekeep cutoff date' to something like 24h (so that only the last 24 hours' worth of data will be kept/plotted). If there is a data overload, MT4 could slow, freeze or (if it runs out of computer memory) crash.
If you've tried everything in all of the replies above, and also the 'Troubleshooting' section of the PDF, then I'm sorry, but I've run out of ideas.
Thanks for your kind greetings, but if you're seeking programming help then your request is much more likely to be noticed if posted in threads like this one.
Thanks once again for your kind words, but I'm neither a noble nor dedicated trader, lol. I merely post my opinions here, right or wrong (and with somewhat less enthusiasm nowadays). All software that I've shared here is free, no strings attached, but if you download and use it expecting that it will provide some kind of an 'edge', that's your assessment, and not necessarily mine; as the saying goes, everything works well, but only some of the time, or until it doesn't. I don't perform coding requests, I merely share some of the indicators and EAs that I've written for my own research. I likewise wish you much happiness and success in all of your trading endeavors. All the best.
After making the change (see post #42), I haven't been able to get the indicator to repaint on my computer's MT4. Hence I can't troubleshoot any further. 
All of the software that I've written using autohotkey is given a clean bill of health by AVG on my computer, and I continue to run these executables on a daily basis without any known issues. However, unless (as with Plot News), another FF member wants to post the zip file elsewhere, it will have to remain unavailable. Personally I don't care if FF bans me, but if I want to be able to undertake development projects outside the fx arena, I need to maintain a reputable image.
Not sure if you mean items #14 and #16 (from the myfxbook/community/outlook page pictured on page 7 of the PDF), which are plotted as the magenta and light blue lines, respectively, on the chart shown on page 11 of the PDF. (However, it doesn't really matter as the software is no longer available).
It's now available here. However please read the note in red typeface above, and understand that if you choose to download and use the app, it's at your own risk.
Final words
I'm done with both this thread, and with this research, as I've achieved what I set out to do. I'm satisfied that the software works correctly, and also with the validity of the conclusions that I reached. For more info, download and read the PDF.
I tried re-coding the downloader to use the outlook API, as was suggested, but the re-coded version returned a "Too many requests; please try again later" error for much of the time. So I will leave the app the way that it was originally, unless/until the myfxbook webpage format is changed, necessitating a compatibility upgrade.
I suppose I'll be accused of promoting the evil forex game, or posting for personal or commercial gain, but........
DislikedIt might be interesting to plot both the % of traders long v short, and also the lot volumes, and observe how these change over time relative to price. Also the average price that retailers are long and short at, and likewise study how this moves relative to price. Unlike the usual price-derived indicators, these values are independent of price, and who knows, they might provide some idea of (imminent) future value. (As we know, potential for bias can exist when value and price diverge sufficiently).
A MT4 indicator could be written to gather the myfxbook data whenever it changes (daily?) and plot these values graphically on a price chart.....Ignored
Please feel welcome to download and use this FREE software. However, read the attached PDF first, as I won't be answering any more questions.
Latest release: 1.33, uploaded Aug 26, 2019. (If you want to keep up to date with the latest version, then please feel welcome to revisit this thread occasionally, as I don't intend to keep bumping it).
PDF file with all instructions. Download and read this first.
Attached File(s)
ZIP file with all necessary install files. See instructions in the 'Installation' section of the PDF.
Note: The zip file has been removed from Forex Factory, due to a virus warning from Windows 10 Defender. However, it checks out OK by both AVG and Kapersky labs, and I've been running it now for several months without any problems, causing me to believe that the Defender warning is a false postive. For anybody who is willing to take the risk, the zip file can now be downloaded from here.
Summary of major conclusions reached
1. Plots of retail volume flows and currency strength are almost the mirror image of each other, telling us that the majority of retail traders look to buy weakness and sell strength (aka "buy low, sell high"). Pair-based plots tend to confirm this, i.e. that while price is rising, sell volumes increase (and buy volumes decrease, thus buy orders are being closed in profit), and all of these operations continue when price consolidates following a rise; and the reverse applies in mirror image scenarios.
2. There is little that can be gleaned from the retail volume flow plots that one can't deduce by merely studying price. In fact the plots lag price somewhat, presumably because it takes retail traders time to react to price movement. (However, one benefit of the retail analysis is that it is timeframe independent, i.e. same value for all TFs, keeping analysis tidy and unambiguous).
3. According to general market theory, buying weakness and selling strength works well enough during sideways periods; P/L is determined by how accurately the trader is able to pick market tops and bottoms. Losses accumulate during periods when the market trends far enough, often enough. Conversely, allowing winners to run, and even adding to winners, works effectively to whatever extent price 'trends'.
4. The stats on the myfxbook outlook page show that the majority of retailers' open positions are under water, many significantly so. This suggests that (1) buying weakness and selling strength is, on balance, an inferior entry strategy; and/or (2) retail traders are leaving their losing trades open longer than their winners.
5. Read this.
Important note: When I use the term "current sentiment" or "prevailing sentiment" (e.g. in posts #21, #25, #26), I don't mean the SSI value (current net long/net short ratio), which is calculated from historical transactions that bring us up to the current point; instead I'm referring to the currently prevailing (collective bullish or bearish) mood that will have an impact on orders that will be placed henceforth. The SSI/volumes value lags the current mood, e.g. for it to move from 80% net long to 80% net short, a large volume of selling must occur (and hence the mood was actually bearish throughout that time).
To see the accompanying plots, and for more observations, read the PDF. And also this FF thread, where the underlying concepts are discussed in more detail (acknowledgements to neilsdigest, osjoe2, and various others for their contributions).
Replies to posts.....
I don't intend replying to any more questions. If you're experiencing problems with the software, please see the 'Troubleshooting' section in the PDF file. If you can't resolve your issue, there are plenty more third party MT4 indicators around for you to play with.
To those members who post(ed) kind comments, these are very much appreciated. Many thanks.
DislikedNot sure if it's possible in an indicator but is it at all possible to add all the pairs together for say the JPY to get one reading. An average of the JPY pairs for example. Awesome trade last week with the GBP/JPY - I do it manually.Ignored
DislikedWhy scrape myfxbook community-outlook html instead of using the outlook-API?Ignored
DislikedChart is daily GBPJPY.. Contrarian as over 80% are buying since May 6th - Little pullback on the 10th May then boom.Ignored
1. Check the settings in your ..../MQL4/Files/myfxoutlook.ini file**
Mine are as follows:
MyfxbookURL=https://www.myfxbook.com/community/outlook
Instruments=*ALL
MT4SymbolSuffix=
OutputFileName=myfxoutlook.csv
Delimiter=,
EncloseInQuotes=1
NumericValuesOnly=0
LocalTimeIsGMTplus=12
MT4TimeIsGMTplus=3
OutputSubfolder=myfxbookdata
OutputDateFormat=Y.M.D H:I
UpdateEveryXminutes=60
HousekeepCutoffDate=2019.06.01
PlaySounds=2
RSIimportFilename=Exported_RSI_values.csv
You need a non-blank and non-zero entries in the green highlighted settings respectively, if you want the timeseries plots on your MT4 charts.
You will need to get the timezone settings (highlighted in yellow) correct for your own location, and your MT4 broker's location., to get the plots to align correctly with the candles. See page 9 of the PDF for more info.
[** In case you're unsure how to edit the ini file:
i) If the myfxbook icon is showing in your systray, right click it and choose Exit, to exit the Download_myfxbook_outlook.exe app.
ii) Go to MT4. Use MT4 dropdown menu option Files -> Open Data Folder
iii) Double click on folder MQL4, and then folder Files
iv) Locate the myfxoutlook.ini file. Right click, and select open with Notepad.
v) Make the necessary changes to the green and yellow highlighted settings, as shown above.
vi) In Notepad, choose dropdown menu option Files -> Save, and then Files -> Exit.
vii) Now you should be back in Windows file manager, double click on the Download_myfxbook_outlook.exe app to re-launch it.
viii) Close Windows file manager, which should return you to MT4.
ix) If you haven't already done so, open a blank new chart, and apply the hanover_consolidated template.]
2. For more detailed instructions, please read the 'Troubleshooting' section on page 17 in the PDF.
3. Note that it might take up to 24 hours of collecting data (while the FX markets are open) before any meaningful trends are discernible.
Dislikedi had changed the setting as u told. As data is downloaded in MQL4\Files\myfxbookdata but still it not reflecting in mt4. Kindly chk details in screen if u can fix it. Thanks makIgnored
Make sure that you can see the little myfxbook icon in your systray, otherwise the download app isn't running, and no data will be collected.
The chart you're showing me is daily. Therefore you will need to gather data, using the new settings, for at least 2-3 days before anything will show on the chart.
Try a shorter TF, e.g. H1. Also if/while myfxbook window into the market is closed for the weekend, no data can be gathered.
Perhaps try setting UpdateEveryXminutes=15 for a while, so that the data files get updated every 15 minutes, instead of 60. Also if you set PlaySounds=2, your computer will give a small beep every time the data is updated.
Important: Try switching backwards and forwards between chart TFs, to force a refresh of all of the indicators.
One minor point, I expect your timezone settings are meant to be 5½ hours ahead of GMT, that is 5.5 hours, not 5.30 (entry should be hours, not hours and minutes)
Give it a day or two, then check that the csv files are starting to fill up with data. Don't leave the files open in Excel, though, because Excel locks the file and prevents any data from being added to it. Switch to a suitable TF chart and hopefully you'll start to see some data starting to emerge like the screenshots I took in the PDF.
Please read the PDF for more info. Everything you need to know is written there. I am just repeating myself.
There are no known bugs in the software, it is all working perfectly on my (Windows 7 64-bit) computer. We are both running the same software. Therefore there must be something different on your computer, but I can't possibly know what it is.
DislikedI'd like to know what formula you used to calculate the values in $$_netVolume_[Currency].csvIgnored
Note that, for the sake of efficiency, new values are appended to the files only if the currently scraped (or calculated) value differs from the last value in the file.
The net volumes where the currency is the first named in the pair are added, if the second named, they are subtracted.
Perhaps best explained by an example; I just took a snapshot of all of the NZD pairs, and their volumes (final value in each file) were as follows:
netVolume_[NZDCHF].csv: 1546.41
netVolume_[NZDUSD].csv: 4192.88
netVolume_[NZDJPY].csv: 2490.8
netVolume_[NZDCAD].csv: 1028.41
NET TOTAL where NZD is first named = 9258.5
netVolume_[GBPNZD].csv: 108.83
netVolume_[EURNZD].csv: -3205.07
netVolume_[AUDNZD].csv: 832.41
NET TOTAL where NZD is second named = -2263.83
TOTAL net volume for NZD = 9258.5 - (-2263.83) = 11522.33, which is in fact the final value in $$_netVolume_[NZD].csv
QED.
Of course there are many other possible approaches (at one point I considered weighting each value in various ways), but for better or worse, that is the calculation that I ended up using.
Note that each curve is INDIVIDUALLY scaled to fit inside the subwindow; therefore the actual values of each plot should not be compared against each other. It's the changes in slope that are important, showing the rate at which total net volume is advancing or declining for that currency. Ideally either (1) each currency should be plotted in its own subwindow (but this would consume too much screen space); or (2) if you want to compare the actual values, then go to the 'Common' tab and set the SAME 'Fixed minimum' and 'Fixed maximum' value for each of the 8 plots (however, this will make it harder to see the changes of slope in the smallest transacted currencies).
Dislikedchange .ini file UpdateEveryXminutes=0 to any minutes and chart will update. But mine looks different than instruction book for some reason even after changing mt4, local time.Ignored
DislikedTrust you're making money......
What's the function of Suspend Hotkeys and Pause Script?.....
I'd love to see $$_netVolume_[XAU].csv in the files and display it in the indicator window. What do I need to do?Ignored
'Pause script' and 'Suspend hotkeys' are not my invention; they are functions built into autohotkey (the programming language that I used to create the exe). As far as I know, selecting 'Pause script' should pause the exe and suspend it from processing (hence no data will be written); the icon in the systray should change to a red box with a 'H' in it. Then click 'Pause script' again to restart the exe from exactly where it left off. (Hence it works much the same as the 'Enable/disable AutoTrading' icon on MT4's toolbar). Of course you could achieve much the same thing by clicking 'Exit', and then running the exe again. Note that if you want the exe to recognize any changes you've made in the settings ini, you must Exit, then change the settings, then run the exe again.
To output consolidated totals for anything other than the 8 major currencies, I would need to enhance the program code. I stopped at the 8 majors because data for all of the relevant 28 pairs was available, making it possible to sum volumes across exactly 7 pairs for each currency, allowing for an even-handed comparison (which is important for the $$_netCount[xxx].csv output). However, I'll give your idea some thought when I get some spare time.**
[EDIT] ** I've made the necessary enhancement, and uploaded the new version. Please read the final page of the PDF ('Version 1.23 release') for more info.
DislikedI have looked at the heatmap on the myfxbook website and I think if one could also import this data into the Excel file using your download_myfxbook_outlook executable it could be of value as a measure to indicate currency strength. I do not know if the myfxbook api allows for this.Ignored
Inserted Code
AUDCAD,-0.4,-1.4,-1.2,-1.2,-2.6,0.1,8.5,-24.4,-24.2
AUDJPY,0.3,-0.6,0.5,0.5,-2.2,0.1,6.1,-30.5,-30.5
AUDNZD,0.0,-1.5,-1.7,-1.7,-3.6,2.8,16.7,64.2,64.2
AUDUSD,0.6,-0.4,-0.9,-0.9,-2.7,-2.9,1.1,-9.0,-8.5
CADJPY,-0.5,-0.2,0.9,0.9,-0.5,-1.0,2.6,-10.1,-10.6
EURAUD,0.3,1.7,3.7,3.7,5.5,2.7,-3.6,-90.4,-90.6
EURCAD,0.1,0.0,1.7,1.7,1.9,2.9,7.0,-124.1,-123.8
EURCHF,0.0,0.4,3.3,3.3,3.5,3.5,8.7,-2.8,-3.2
EURCZK,9.9,-20.1,-39.8,-39.8,-30.0,-30.0,-30.0,367.2,367.4
EURGBP,0.1,-1.0,-0.6,-0.6,0.4,-1.8,-2.6,28.8,29.0
EURJPY,-0.7,-0.9,2.6,2.6,0.5,1.0,3.3,-118.9,-118.8
EURUSD,0.3,-0.4,0.9,0.9,-0.9,-2.4,-3.4,-78.9,-79.2
GBPJPY,-0.9,0.8,3.7,3.7,-0.1,4.4,13.2,-161.1,-160.7
GBPUSD,0.0,1.0,2.2,2.2,-2.0,0.1,4.1,-114.0,-114.4
NZDUSD,0.4,0.0,-0.1,-0.1,-0.9,-4.8,-9.3,-40.4,-40.4
USDCAD,0.0,-0.4,0.8,0.8,2.4,5.6,13.9,-17.2,-17.2
USDCHF,-0.2,0.9,1.9,1.9,3.9,5.9,10.9,68.5,68.6
USDJPY,0.0,0.0,2.1,2.1,1.3,3.6,7.3,-29.1,-29.5
XAGUSD,0.6,0.7,-0.1,-0.1,0.5,-0.9,1.2,8.8,8.7
XAUUSD,13.0,49.0,-8.0,-8.0,29.0,-51.0,109.0,2020.0,2020.0
DislikedThis is what i got, kindly help with brief steps on how to have the price and volumes line addedIgnored
DislikedI'm trying to figure out how to make .csv files update independently on the computer where my MT4 is currently running. ..... could you make just one tweak to your Download_myfxbook_outlook.exe app so that it could be configured to download already generated files from a certain remote server?Ignored
If you do want to run both MT4 and the download app on separate computers for whatever reason, then you would need to find a programmer to write another app that also runs concurrently in the background, and transfers the necessary files between the two computers. I'm not currently in a position to do this.
Then re-run the app, and check that your settings are the same as mine:
Attached Image (click to enlarge)
The items highlighted in green are crucial. [Also, please note that you'll need to get your timezone settings (yellow highlight) correct — more info on page 15 of the freshly uploaded PDF — if you want the timeseries to plot under the correct candles].
Note that it will take several hours for any meaningful trends to plot (with these settings it is loading only one datapoint every 60 minutes).
After that, try switching the chart to the next highest TF, and then back again. This forces a refresh of the chart.
Also, please read the comprehensive 'Troubleshooting' section starting on page 24 of the PDF. Good luck.
NOTE: By setting 'Update every ? minutes' to 1, you will be picking up virtually every change, hence the app will potentially gather vast amounts of data. In which case I would set the 'Housekeep cutoff date' to something like 24h (so that only the last 24 hours' worth of data will be kept/plotted). If there is a data overload, MT4 could slow, freeze or (if it runs out of computer memory) crash.
DislikedGreetings you all here on ff.......i was hoping and wondering if any mt4 coder out there can remove the line piercing the candlesIgnored
DislikedThats a truly amazing find with the currency strength chart at scorpion fx, that is powerful indeed!!!...how much is it to to get that type of chart information on the currency strength and weakness you posted??????Ignored
DislikedUnfortunately, Composite RSI still repaint. Even 8-9 candles backward and cancels previously received signals at 70/30 levels,especially if we have some big changes in current price-candle. I have noticed that right now after CAD Employment Change report release. Like you said It repaints because it necessarily applies the higher TF RSI values retrospectively.. That must be itIgnored
Dislikedit's such a shame about the odd over-zealous trojan flag.........hope the Plot myfxbook indi will become available again.........Ignored
DislikedI would be very pleased if one day Your magic indicator could plot also graphs of the hystorical average prices charge short/long......Ignored
DislikedHi, Can someone please find me the code related to this thread, as the zip files are already removed from post 1.Ignored
Final words
I'm done with both this thread, and with this research, as I've achieved what I set out to do. I'm satisfied that the software works correctly, and also with the validity of the conclusions that I reached. For more info, download and read the PDF.
I tried re-coding the downloader to use the outlook API, as was suggested, but the re-coded version returned a "Too many requests; please try again later" error for much of the time. So I will leave the app the way that it was originally, unless/until the myfxbook webpage format is changed, necessitating a compatibility upgrade.