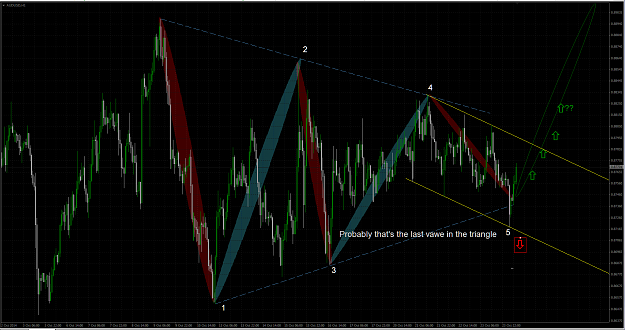
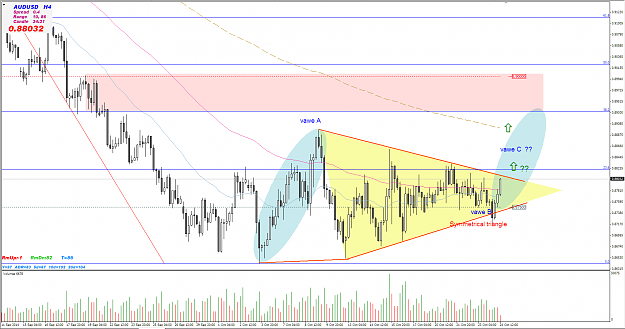
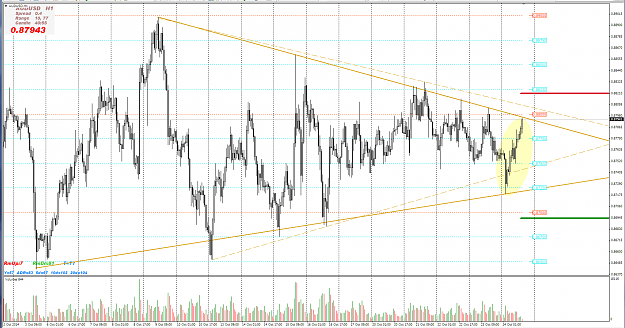
{quote} Seems to me still a good long trade with around 80 pips left to go up. Also, H1 chart shows ascending triangle being formed hinting to bullish breakout... {image}
Ignored
Should say 50-80 depending on where it bounces. I do expect another bounce at the top around 8825ish area. Then back down again.
{quote} Should say 50-80 depending on where it bounces. I do expect another bounce at the top around 8825ish area. Then back down again. Or so it would seem
Ignored
Technically, the minimum would be 38% of wave A, which agrees with the calculations of You, about 80-90 pips. Top line of the triangle, more or less. But those pips can be multiplied, depending on everything that affects the market.
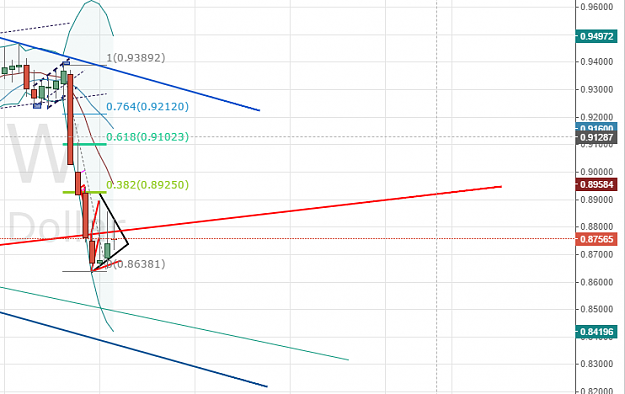
I can see on H4 a descending channel, if it will not come back down from daily pivot, I hope it will come back from 0.8790. Up moves are stronger than down moves? Or it is because i have short positions and I am not objective?
I can see on H4 a descending channel, if it will not come back down from daily pivot, I hope it will come back from 0.8790. Up moves are stronger than down moves? Or it is because i have short positions and I am not objective?
Ignored
Yes there is a channel. It also looks at H1. But the channels begin and end.
We will see.
I can see on H4 a descending channel, if it will not come back down from daily pivot, I hope it will come back from 0.8790. Up moves are stronger than down moves? Or it is because i have short positions and I am not objective?
Ignored
I love channels as they really help in finding good entry and exit points. But with the range tightening up so much on this pair right now, it seems to me the only way to look at it, is straight up and down, and trade it that way. Or wait for the breakout.
Trying to trade a channel in this tight range could end up frustrating...
Just my opinion, as I started trading channels with this thing last week, and it worked great. But now, not so great...
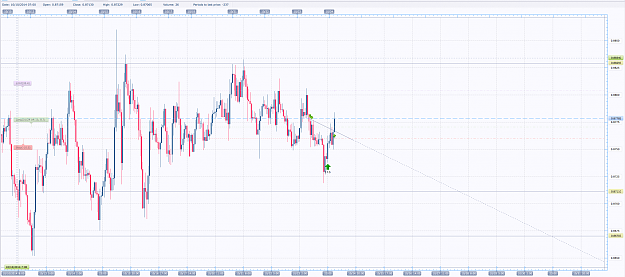
If you look at EURUSD chart and compare it to AUDUSD you will see they are similar. Therefor, once EURUSD goes up we will go up also. ( This is my own opinion).
{quote} Technically, the minimum would be 38% of wave A, which agrees with the calculations of You, about 80-90 pips. Top line of the triangle, more or less. But those pips can be multiplied, depending on everything that affects the market.
{quote} It does look like a fluke, but to me it looks like a testing of the 0.8750 level. I don't know, feels like it was kind of inevitable after so many tries. But mid-Asian session A/U seems to be recovering back into .8740s and London will probably get it back into the 60s.....