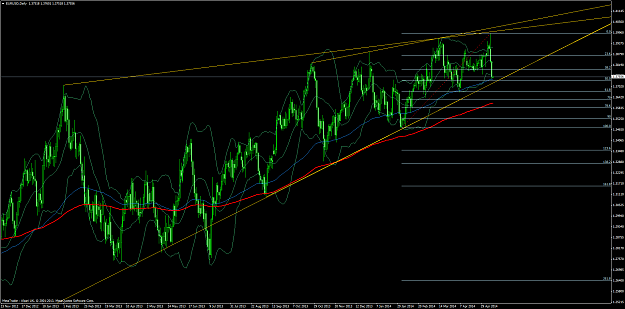
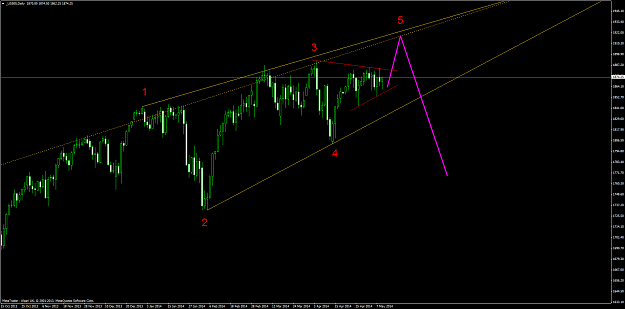
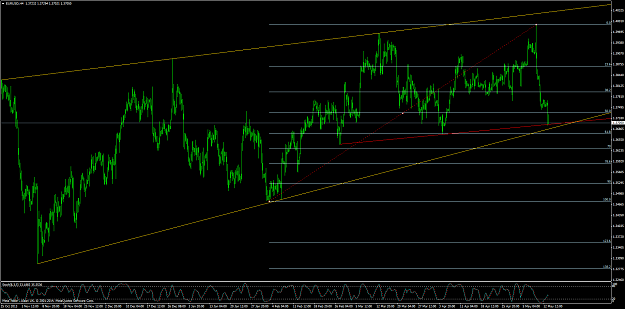
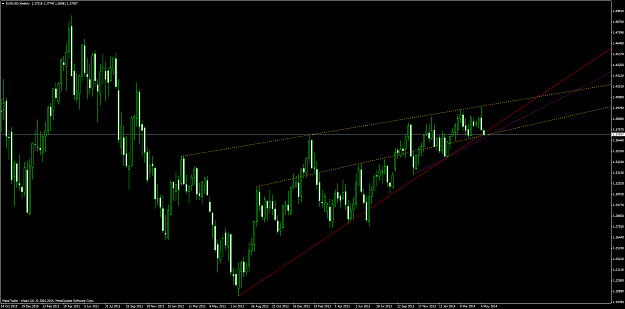
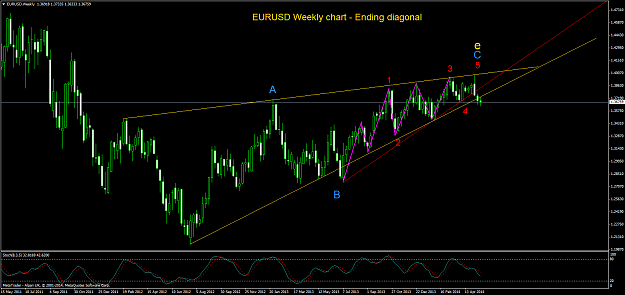
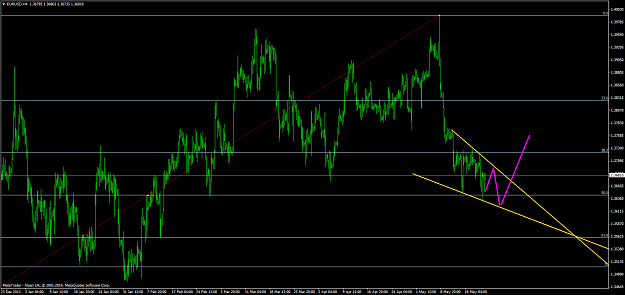
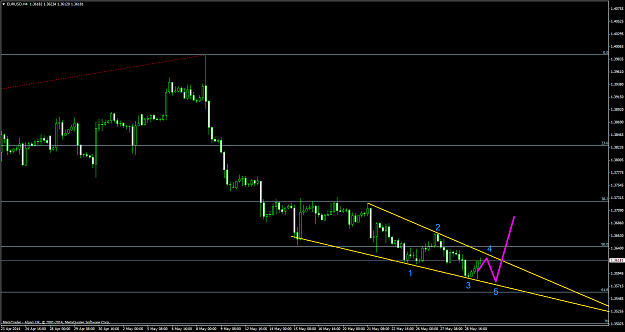
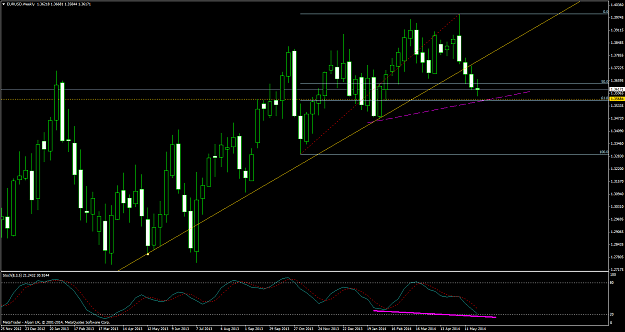
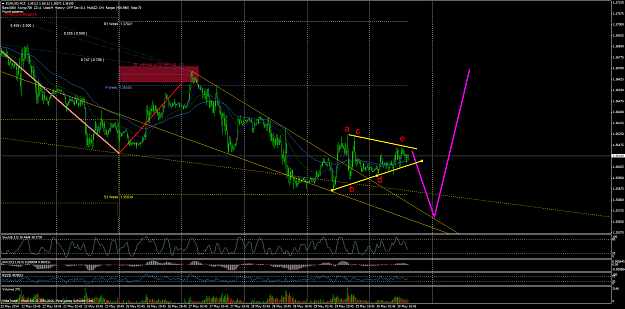
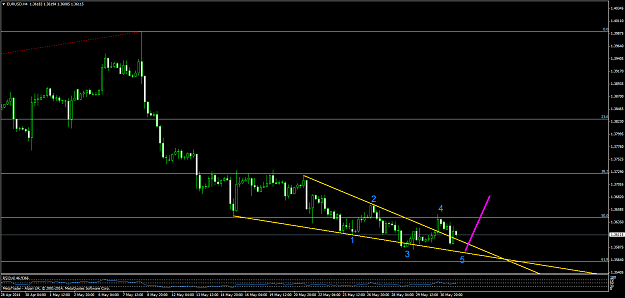
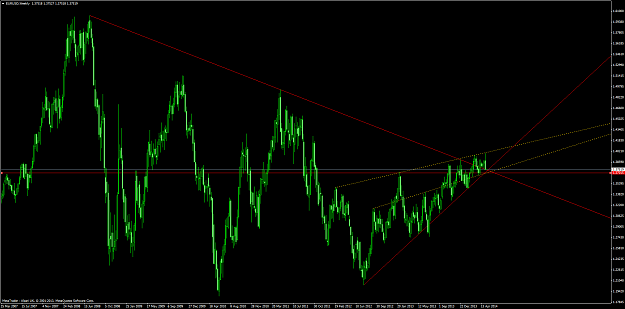
• Home
  • Forums
  • Trades
  • News
  • Calendar
  • Market
  • Brokers
  • Login
  • Join
  • User/Email: Password:
  • 12:50pm
  • Search
Menu
  • Forums
  • Trades
  • News
  • Calendar
  • Market
  • Brokers
  • Login
  • Join
  • 12:50pm
Search
Sister Sites
  • Metals Mine
  • Energy EXCH
  • Crypto Craft

Options

Search
Search
Search

Bookmark Thread

First Page First Unread Last Page Last Post

Printable Version

  • Interactive Trading
  • /
  • Reply to Thread
  • Subscribe
  • 83
Attachments: Long Term Analyses - EURUSD, GOLD, and S&P
Exit Attachments

Long Term Analyses - EURUSD, GOLD, and S&P

  • Last Post
  •  
  • 1 2Page 3 4
  • 1 2Page 3 4
  •  
  • Post #41
  • Quote
  • May 11, 2014 6:28pm May 11, 2014 6:28pm
  •  enterfx
  • Joined Nov 2009 | Status: The Trend is Your Friend | 1,123 Posts
Quoting enterfx
Disliked
{quote} Today the EURUSD turned down hard from just a few pips shy of 1.40. It looks like we may have the 5th wave in place of this huge ending diagonal. However as seen on daily tf, price has yet to confirm a downtrend by taking out critical pivot levels and trendlines. weekly: {image} daily: {image}
Ignored

EURUSD - Weekly Update

On april 6 I called for new highs towards and into the 1.40 level whereafter we should see a massive decline from a finished Ending Diagonal.
#post7386920

So far it has turned out to be correct.... but

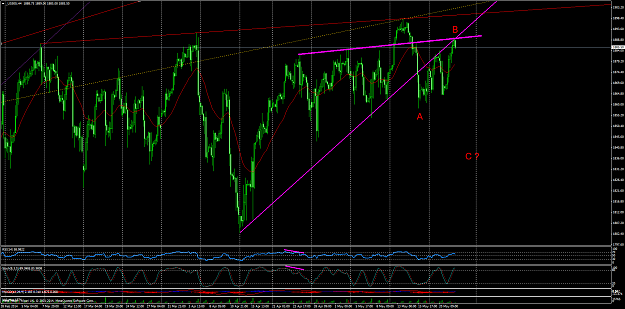
a look at the EurUsd and the 2 days massive decline with barely no pullback, makes this decline a little suspect in my eyes.

Right now price sits above strong resistance at 1.3675 > 1.3740 and a strong pullback may be in store soon.
As seen on the charts price has reached the lower bollinger band, the 100EMA and at 3730 we have the 50% fib of the April 4 low
as well as supportlines and conluences.

The price has yet to take out any critical levels and could still (potentially) make a new high slightly above the current high without
compromising any structure in the ending diagonal theory. time will tell.

Weekly chart:
Attached Image (click to enlarge)
Click to Enlarge

Name: eurusdweekly1105.png
Size: 103 KB


Daily:
Attached Image (click to enlarge)
Click to Enlarge

Name: eurusddaily.png
Size: 117 KB
  • Post #42
  • Quote
  • May 11, 2014 6:50pm May 11, 2014 6:50pm
  •  enterfx
  • Joined Nov 2009 | Status: The Trend is Your Friend | 1,123 Posts
Quoting enterfx
Disliked
GOLD XAU/USD -- Weekly and monthly analyses There's been plenty of calls that gold has made a bottom and the trend has resumed to the upside. I find some missing pieces in the long term picture for this to be the case... {image}
Ignored

GOLD XAU/USD - Weekly update :

No change in the bigger picture for Gold. I remain bearish and my post back on April 6 is still valid : #post7386922
  • Post #43
  • Quote
  • May 13, 2014 11:02am May 13, 2014 11:02am
  •  enterfx
  • Joined Nov 2009 | Status: The Trend is Your Friend | 1,123 Posts
Quoting enterfx
Disliked
{quote} S&P500 (ES) - Weekly update: We now may have a setup for a rally this coming week in the S&P index. If my counts and analyses is correct this should be a final 5th wave up. I am also basing this on the structure of the last week's PA which is suggesting a bullish triangle where the potential thrust/breakout of this should be terminal and also the conclusion of an ending diagonal. (as seen on the daily chart). We witnessed a massive decline in the EURUSD last week and something similar might be in store in the S&P...
Ignored

S&P ES: On Sunday I called for a rally and so far the S&P has advanced 23 pts.
On the daily and weekly chart the move looks strong, (as allways into new highs), but on the smaller timeframes the advance is debatable.

If we start sideways to lower trading the next couple days we can assume the 3rd wave is more or less done as indicated on the peak of the 1Hour RSI.
then after a pullback another 5th wave into new highs will be my preferred sellzone.


SUNDAY's daily Chart - posted May 11:
Attached Image (click to enlarge)
Click to Enlarge

Name: _us500daily1105.png
Size: 82 KB


Today:
Attached Image (click to enlarge)
Click to Enlarge

Name: _us500daily1305.png
Size: 84 KB


1Hour - possible scenario - remains to be seen of course.
Attached Image (click to enlarge)
Click to Enlarge

Name: _us500h11305.png
Size: 129 KB
  • Post #44
  • Quote
  • May 13, 2014 11:12am May 13, 2014 11:12am
  •  PipsMaster23
  • | Joined Mar 2010 | Status: Member | 522 Posts
Nice forum..

SP500
I called 1900 - 1910 as a possible top before seeing a decline, of course for me we need to monitor the JPY pairs in order to determine outflows, but 1910 comes in with a 161.8% projection Fib level. Should offer good RR for shorting.

EURUSD
With current declines without any pullback i am also suspect of this too, especially that these decline came from making of a fresh high and no failure swing played out. I still have levels of 1.4050 and 1.42 and only a break below 1.3650 will negate this outlook. Strong support comes in at 1.3670/90 levels

GOLD
No view
Cheers!! PM23
  • Post #45
  • Quote
  • May 13, 2014 11:27am May 13, 2014 11:27am
  •  enterfx
  • Joined Nov 2009 | Status: The Trend is Your Friend | 1,123 Posts
Quoting PipsMaster23
Disliked
Nice forum.. SP500 I called 1900 - 1910 as a possible top before seeing a decline, of course for me we need to monitor the JPY pairs in order to determine outflows, but 1910 comes in with a 161.8% projection Fib level. Should offer good RR for shorting. EURUSD With current declines without any pullback i am also suspect of this too, especially that these decline came from making of a fresh high and no failure swing played out. I still have levels of 1.4050 and 1.42 and only a break below 1.3650 will negate this outlook. Strong support comes in at...
Ignored
Thanks Master.

The S&P prices you refer to is that ES or cash index?

The Euro has been and still is a hard nut to crack with its nonsense moves the past year. I share your view as I was looking for price to reach 1.4025 >>.
  • Post #46
  • Quote
  • May 13, 2014 11:36am May 13, 2014 11:36am
  •  enterfx
  • Joined Nov 2009 | Status: The Trend is Your Friend | 1,123 Posts
Quoting enterfx
Disliked
{quote} EURUSD - Weekly Update On april 6 I called for new highs towards and into the 1.40 level whereafter we should see a massive decline from a finished Ending Diagonal. #post7386920 So far it has turned out to be correct.... but
Ignored

EURUSD -

Allmost 300pips in straigth line down with barely any pullbacks.
Oversold conditions and some divergences are now showing. Maybe one more low will give way to the upside.

If it doesn't bounce from these levels I don't get it....

4 Hour:
Attached Image (click to enlarge)
Click to Enlarge

Name: eurusdh41305.png
Size: 106 KB


Weekly:
Attached Image (click to enlarge)
Click to Enlarge

Name: eurusdweekly.png
Size: 95 KB
  • Post #47
  • Quote
  • May 13, 2014 11:49am May 13, 2014 11:49am
  •  PipsMaster23
  • | Joined Mar 2010 | Status: Member | 522 Posts
Quoting enterfx
Disliked
{quote} Thanks Master. The S&P prices you refer to is that ES or cash index? The Euro has been and still is a hard nut to crack with its nonsense moves the past year. I share your view as I was looking for price to reach 1.4025 >>.
Ignored
ES
Cheers!! PM23
  • Post #48
  • Quote
  • May 13, 2014 11:54am May 13, 2014 11:54am
  •  PipsMaster23
  • | Joined Mar 2010 | Status: Member | 522 Posts
BTW, nice thread and very much up my street... well done... i will try and post as often as i can with charts as i trade a wide caiety of asset classes.

Good job!

As for decline without any bounce, it can happen and i think the EURUSD can do up to 400 pips in a normal trading environment, however, this ultimately is not a healthy move in PA and therefore builds the case even more so that we should see an advance North in price, but 1.3670 ish levels may still have its part to play in all this!
Cheers!! PM23
  • Post #49
  • Quote
  • May 13, 2014 12:05pm May 13, 2014 12:05pm
  •  enterfx
  • Joined Nov 2009 | Status: The Trend is Your Friend | 1,123 Posts
Quoting PipsMaster23
Disliked
BTW, nice thread and very much up my street... well done... i will try and post as often as i can with charts as i trade a wide caiety of asset classes. Good job! As for decline without any bounce, it can happen and i think the EURUSD can do up to 400 pips in a normal trading environment, however, this ultimately is not a healthy move in PA and therefore builds the case even more so that we should see an advance North in price, but 1.3670 ish levels may still have its part to play in all this!
Ignored


Agreed.
  • Post #50
  • Quote
  • May 13, 2014 3:02pm May 13, 2014 3:02pm
  •  enterfx
  • Joined Nov 2009 | Status: The Trend is Your Friend | 1,123 Posts
Quoting enterfx
Disliked
{quote} S&P ES: On Sunday I called for a rally and so far the S&P has advanced 23 pts. On the daily and weekly chart the move looks strong, (as allways into new highs), but on the smaller timeframes the advance is debatable. If we start sideways to lower trading the next couple days we can assume the 3rd wave is more or less done as indicated on the peak of the 1Hour RSI. then after a pullback another 5th wave into new highs will be my preferred sellzone. SUNDAY's daily Chart - posted May 11: {image} Today: {image} 1Hour - possible scenario - remains...
Ignored


S&P ES is struggling here. With a pierced and flat upper bollinger band on daily chart, the upmove may be very limited.
Tempted to short here but will wait to see what the rest of the day will bring. consolidating atm

Attached Image (click to enlarge)
Click to Enlarge

Name: _us500daily1305-b.png
Size: 110 KB
  • Post #51
  • Quote
  • May 22, 2014 6:00am May 22, 2014 6:00am
  •  enterfx
  • Joined Nov 2009 | Status: The Trend is Your Friend | 1,123 Posts
S&P ES - Update:

Bigger picture remains up for a new all time high, but potential C wave down in store st:

Daily:

Attached Image (click to enlarge)
Click to Enlarge

Name: _us500daily2205.png
Size: 121 KB


4Hour:

Attached Image (click to enlarge)
Click to Enlarge

Name: _us500h4.png
Size: 133 KB
  • Post #52
  • Quote
  • May 22, 2014 6:32am May 22, 2014 6:32am
  •  enterfx
  • Joined Nov 2009 | Status: The Trend is Your Friend | 1,123 Posts
Quoting enterfx
Disliked
{quote} EURUSD - Weekly Update On april 6 I called for new highs towards and into the 1.40 level whereafter we should see a massive decline from a finished Ending Diagonal. #post7386920 So far it has turned out to be correct.... but
Ignored

EURUSD:

Seemingly the EurUsd has broken several supportlines, but could be setting up for a rally soon. I remain suspecious of this decline without a decent pullback. The trouble is also that when it first starts to rally it could also make a new high without compromising the ED. Neutral bias atm. Looking to buy a possible wedge setup.

Weekly:
Attached Image (click to enlarge)
Click to Enlarge

Name: eurusdweekly2205.png
Size: 77 KB


4hour - Possible wedge and bull setup

Attached Image (click to enlarge)
Click to Enlarge

Name: eurusdh42205.png
Size: 77 KB
  • Post #53
  • Quote
  • May 22, 2014 6:54am May 22, 2014 6:54am
  •  enterfx
  • Joined Nov 2009 | Status: The Trend is Your Friend | 1,123 Posts
Quoting enterfx
Disliked
{quote} UPDATE on GOLD XAU/USD -- Weekly and monthly analyses Refer to my first post for complete review: #post7386922
Ignored

GOLD XAU/USD has been trading near flat in a Triangle shape.
If my count is correct the current upmove should be a E-wave where we will see a decline to lower prices, before a new leg up.

If it breaks to the upside, the move should be limited.


Attached Image (click to enlarge)
Click to Enlarge

Name: xauusdh42205.png
Size: 91 KB
  • Post #54
  • Quote
  • May 22, 2014 7:10am May 22, 2014 7:10am
  •  devang
  • | Joined Apr 2012 | Status: Member | 89 Posts
  • Post #55
  • Quote
  • May 29, 2014 7:49am May 29, 2014 7:49am
  •  enterfx
  • Joined Nov 2009 | Status: The Trend is Your Friend | 1,123 Posts
Quoting enterfx
Disliked
{quote} EURUSD: Seemingly the EurUsd has broken several supportlines, but could be setting up for a rally soon. I remain suspecious of this decline without a decent pullback. The trouble is also that when it first starts to rally it could also make a new high without compromising the ED. Neutral bias atm. Looking to buy a possible wedge setup. Weekly: {image} 4hour - Possible wedge and bull setup {image}
Ignored
EURUSD decline is halting, litterally. It does not look like the "big" downturn to me so far
On the 4hour chart we can spot a potential Ending Diagonal wedge, where, after a marginal new low, we could see a strong reversal/bounce to the upside.

On the weekly chart we can spot hidden divergence and oversold Stochastics. Also, price stand right above the 61.8 fib (3560), of the 1.3476 low in February.

4 Hour - Ending Diagonal with one more low?

Attached Image (click to enlarge)
Click to Enlarge

Name: eurusdh42905.png
Size: 62 KB


Weekly

Attached Image (click to enlarge)
Click to Enlarge

Name: eurusdweekly.png
Size: 81 KB
  • Post #56
  • Quote
  • May 29, 2014 8:01am May 29, 2014 8:01am
  •  enterfx
  • Joined Nov 2009 | Status: The Trend is Your Friend | 1,123 Posts
Quoting enterfx
Disliked
S&P ES - Update: Bigger picture remains up for a new all time high, but potential C wave down in store st:
Ignored
Looking for a wave 4 down before new highs will be seen.


4 hour chart

Attached Image (click to enlarge)
Click to Enlarge

Name: _us500h42905.png
Size: 99 KB
  • Post #57
  • Quote
  • May 29, 2014 8:33am May 29, 2014 8:33am
  •  enterfx
  • Joined Nov 2009 | Status: The Trend is Your Friend | 1,123 Posts
Quoting enterfx
Disliked
{quote} GOLD XAU/USD has been trading near flat in a Triangle shape. If my count is correct the current upmove should be a E-wave where we will see a decline to lower prices, before a new leg up. If it breaks to the upside, the move should be limited. {image}
Ignored

GOLD XAU/USD took a hard hit this week as the assumed triangle unfolded and price broke down.
All bullish calls recently has been proved wrong and price has more downside still in this D-wave of the larger triangle.

Daily:

Attached Image (click to enlarge)
Click to Enlarge

Name: xauusddaily2905.png
Size: 73 KB
  • Post #58
  • Quote
  • May 30, 2014 8:00am May 30, 2014 8:00am
  •  enterfx
  • Joined Nov 2009 | Status: The Trend is Your Friend | 1,123 Posts
Quoting enterfx
Disliked
{quote} EURUSD decline is halting, litterally. It does not look like the "big" downturn to me so far On the 4hour chart we can spot a potential Ending Diagonal wedge, where, after a marginal new low, we could see a strong reversal/bounce to the upside. On the weekly chart we can spot hidden divergence and oversold Stochastics. Also, price stand right above the 61.8 fib (3560), of the 1.3476 low in February. 4 Hour - Ending Diagonal with one more low? {image} Weekly {image}
Ignored

EURUSD - Update on the Ending diagonal pattern.

Looks like a small triangle in works.

Attached Image (click to enlarge)
Click to Enlarge

Name: eurusdm15.png
Size: 132 KB


4Hour chart still showing the ED potential
Attached Image (click to enlarge)
Click to Enlarge

Name: eurusdh42905.png
Size: 62 KB
  • Post #59
  • Quote
  • Jun 1, 2014 5:57pm Jun 1, 2014 5:57pm
  •  enterfx
  • Joined Nov 2009 | Status: The Trend is Your Friend | 1,123 Posts
Quoting enterfx
Disliked
{quote} Looking for a wave 4 down before new highs will be seen. 4 hour chart {image}
Ignored

S&P500 (ES) - Weekly update:

The big question is now at hand. Is this the last gasp of bullrun before a larger pullback in the coming weeks?
If the index starts to "wingle" at this area and make a minor pullback (WHICH IS DUE), early this week, I will
look for sell setups when the index hit new highs after that.

It all remains to be seen, but we do have several technical confluences on the short and longer term charts.

A potential ending diagonal may be in works, if that's the case, we could see some sharp and brutal moves
to the downside when the top is done.

One scenario I'm looking for - 4Hour chart:

Attached Image (click to enlarge)
Click to Enlarge

Name: _us500h40106.png
Size: 102 KB


Daily:
Attached Image (click to enlarge)
Click to Enlarge

Name: _us500daily0106.png
Size: 87 KB
  • Post #60
  • Quote
  • Jun 2, 2014 9:16am Jun 2, 2014 9:16am
  •  enterfx
  • Joined Nov 2009 | Status: The Trend is Your Friend | 1,123 Posts
EURUSD: The ending diagonal may still be alive.

Attached Image (click to enlarge)
Click to Enlarge

Name: eurusdh40206.png
Size: 58 KB
Thread Tools Search this Thread
Show Printable Version Show Printable Version
Email This Thread Email This Thread
Search this Thread:

Advanced Search

  • Interactive Trading
  • /
  • Long Term Analyses - EURUSD, GOLD, and S&P
  • Reply to Thread
    • 1 2Page 3 4
    • 1 2Page 3 4
0 traders viewing now
  • More
Top of Page
  • Facebook
  • Twitter
About FF
  • Mission
  • Products
  • User Guide
  • Media Kit
  • Blog
  • Contact
FF Products
  • Forums
  • Trades
  • Calendar
  • News
  • Market
  • Brokers
  • Trade Explorer
FF Website
  • Homepage
  • Search
  • Members
  • Report a Bug
Follow FF
  • Facebook
  • Twitter

FF Sister Sites:

  • Metals Mine
  • Energy EXCH
  • Crypto Craft

Forex Factory® is a brand of Fair Economy, Inc.

Terms of Service / ©2019