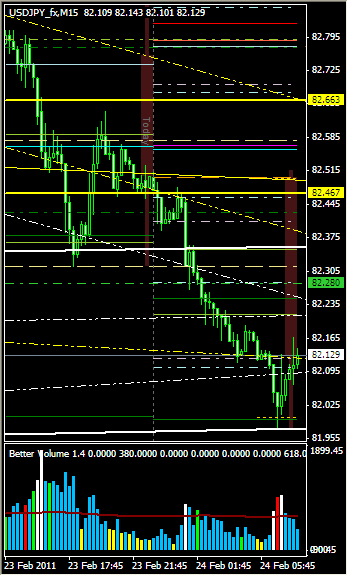
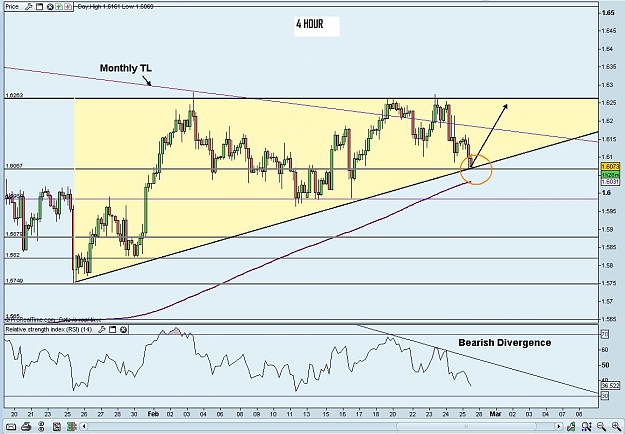
I've been posting this chart for a while now, and see that we have finally broken south of the descending magenta TL - admittedly, if spanned in onto a 1hr chart and so perhaps not indicative of any long-term trend. (EDIT - perhaps a little confusing - the trend is certainly down, but now that price is in unchartered territory, I'm not so sure what will happen next, and so am cautious of calling it either way.)
Erm, I'm running out of space here at the bottom as what you see on the monthly is all that I get.
Anybody got something with more data? Not that it would matter, as this, if I am correct in assumption - the mother of all trip ups, and an indication that I have yet to hit Google - is the lowest level yet in UC.
Attached Image(s) (click to enlarge)
Author of: For Pip's Sake! (Available at Amazon... :-) )