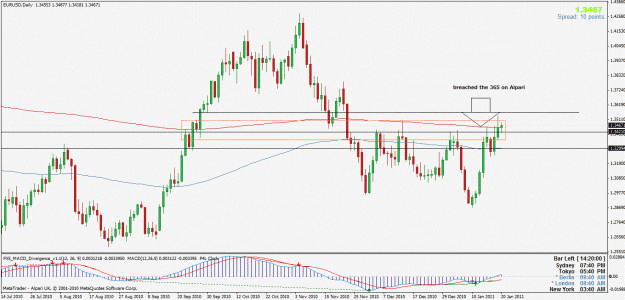
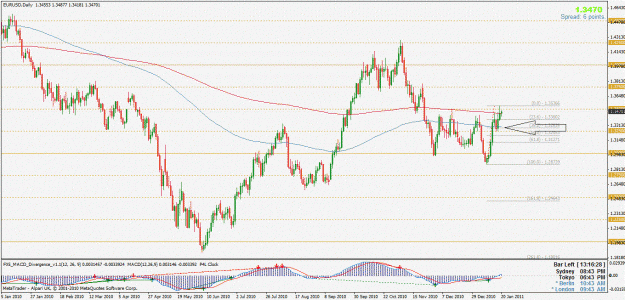
I was asked what the lines on this Euro daily chart were in reference to and why.
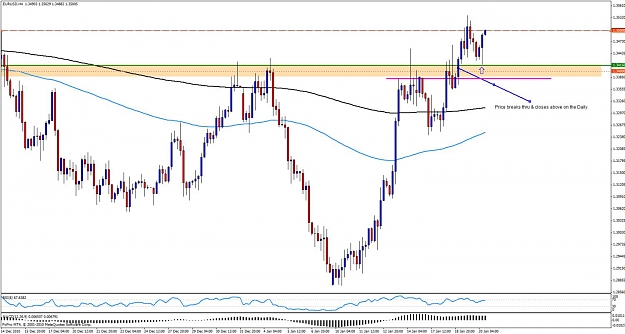
Magenta line is the recent Daily closes . .lining up nicely, 1.3385ish.
Green line is the highest close of the PPZ level (at the green check mark), 1.3415ish.
Dotted line is a Round Number, 1.3400.
Dash line is the Big Round Number, 1.3500
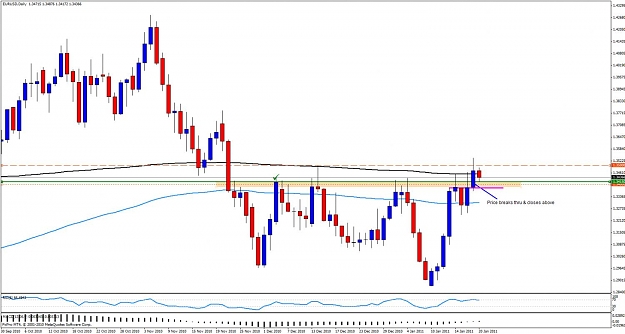
Price has broken through these lines of Resistance on the Daily (except for the 1.3500) and I will look for is area to now act as Support . .bullish PA.
Attached Image (click to enlarge)
Indicators show the past. Price Action "Indicates" the future.