[quote=beck7777;3809199]i read all the pages but still have the problem of the mode of entry
Please explain a simple facility with chart[i think everybody is confused here for entry. according to me in simple way forgot about the name of indicator 5 min alf or anything this makes confuse to everyone.
i think if u got chart as same in this thread ONE LINE WITH THICK BLUE LINE and ONE WITH THIN BLUE LINE
FOR
LONG..........1. all candle should be on above both lines i mean thick and thin blue line
2. for exact entry when price (candle ) cross the thick blue line to up side and close up side on the blue thick line thn enter long on close of this candle
Hi Bbolss, thanks for sharing your system. I had a programmer develop a support and resistance indi I've called Fractal Lines and I would like to share it. I recall someone mentioning they'd like such an indicator earlier in this thread. Essentially, what this indi will allow you to do is to specify the quality of the fractal from which the support or resistance is generated. It works as a MTF support and resistance tool.
Parameters:
Bars retrace: This is the number of bars that must form after the high, without price breaching that level, before that fractal is valid from which to draw a 'fractal line'.
Pips retrace: This is the number of pips that price must retrace from the high before it is a valid fractal.
No bars to left: This is the same as the Bars retrace but is the number of bars that must have formed before (to the left) of the fractal high before that fractal is valid from which to draw a fractal line.
Because we are using 1 minute time frame with your system, the support and resistance typically generated is weak. So, you I would recommend entering, for example, 20 or 30 in the 'bars retrace' and 'no bars to left' parameters. This means you are basically being indicated what would be support and resistance on a higher time frame chart and is thus more reliable.
Don't worry about the parameters session extremes, session start or session end. They are not important. Leave it false.
Max lines is important. I usually set it to 3. Many more than that and you won't see your screen for all the lines. Max duration means the number of bars after the formation of a fractal line that the line will remain visible on the chart. Previous fractals will be indicated by red and green arrows.
It sounds complicated but it is really simple. Anyone is welcome to use it if you feel it will be of benefit.
i read all the pages but still have the problem of the mode of entry
Please explain a simple facility with chart
Ignored
I hope this helps.
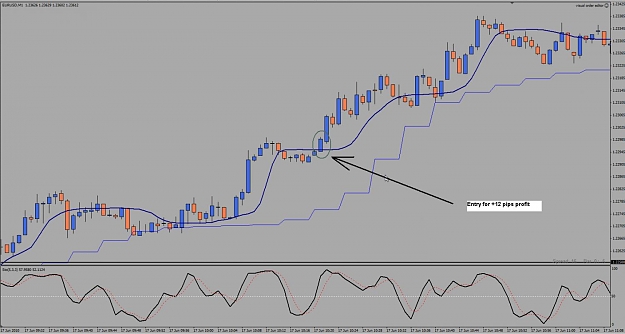
The pattern you see here is one I particularly like. You see how we are in a strong uptrend? The lighter blue line is the 5 minute ALF on a 1 minute chart. As you can see, this is moving up - the first confirnation we need for entry.
The thicker blue line is the M1 ALF. The green circled candle is our entry as it has closed above the ALF in the direction of the trend. The reason why I like this trade is because we have a rounded bottom to the retrace with a collection of doji candles and small candles followed by a larger momentum candle. This shows you that the retrace is dying and that the market is moving back into the trend.
I took 13.5 pips, 12 pips profit after spread. My risk was 10 pips including spread.
Obviously it moved a great deal more but you can't worry about that when scalping. Get what you can and get out, preferably with as much as you risked on the trade or more.
The pattern you see here is one I particularly like....
Ignored
without rsi and breaks ?;d nice
i just get back from my exam
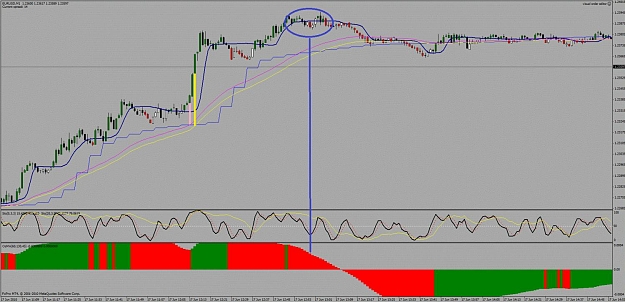
im testing new indicator as a filter
check out osma with settongs 60 130 45 ! (its 12 26 9)*5 so it is a way to see osma as on 5min... indi in attach..
se how nicly filtered to bad trades right now
and i took +10 here entrer at break of last high
without rsi and breaks ?;d nice
i just get back from my exam
im testing new indicator as a filter
check out osma with settongs 60 130 45 ! (its 12 26 9)*5 so it is a way to see osma as on 5min... indi in attach..
se how nicly filtered to bad trades right now
and i took +10 here entrer at break of last high
Ignored
Yep, just an ALF trade that one.
Does this indi stop you getting good trades as well as filtering out bad ones?
Sure, it is just 2 stoch lines one fast one slower.
When price is crossing the ALF just look at the stoch lines.
The faster one (darker blue) will tell you when to go when it turns and confirms the ALF cross and the same direction of the light blue (slower) stoch line or the stoch lines may already be in sinc with the ALF crossing..
The dark blue (fast) line will simply put you in sinc with the dips and peaks.
JMO but I think it is a relatively clear indication of short term direction..
Ignored
Thanks, i'll take a look.
There is a danger though that by trying to filter out some bad trades, we filter out as many or more winning trades. Any additions I think need to be tested and proven to be genuine enhancements.
Personally, I think the maximum expectation for an effective M1 scalping strat is 80% if you intend on making any serious money from it.
Sure, it is just 2 stoch lines one fast one slower.
When price is crossing the ALF just look at the stoch lines.
The faster one (darker blue) will tell you when to go when it turns and confirms the ALF cross and the same direction of the light blue (slower) stoch line or the stoch lines may already be in sinc with the ALF crossing..
The dark blue (fast) line will simply put you in sinc with the dips and peaks.
JMO but I think it is a relatively clear indication of short term direction..
Ignored
i still not get it mayby because of my english
can you write it more simple?
we have to look at 0 point or on cross this 2 lines?
thanx
bbolss hi, no doubt its a great system. I had 90% winning trades or may more than 90% with your system. I use Ema as well. when 60ema penetrate between MT ALF and alf after that i apply your rules and i take any available signal.
i am confident, anyone doing practice on your system for month, i am sure this will bring lot more profit to him. I normally avoid adding more indicators to original system but 60ema helped me lot.
i was even thinking about connecting it to dashalt scalp system
he use ema 50 20 and 8 and scalp with stoch wneh all emas are in right place
but it was a litle strange with all this emas and alf to many lines
simple is best
@bigmanin whad do you think about ema 50 instead of 60?
look a litle faster with similar results
in fact mayby even better
check here fore example
with ema 60 entry to late?;p
and see blue circle how nicli osma filter mad trades there
emas dont?
@bigmanin whad do you think about ema 50 instead of 60?
look a litle faster with similar results
in fact mayby even better
check here fore example
with ema 60 entry to late?;p
and see blue circle how nicli osma filter mad trades there
emas dont?[/quote]
Yes, bbolss i have to agree with you, it looks more accurate than 60ema.
keep it up
thanks
i read all the pages but still have the problem of the mode of entry Please explain a simple facility with chart[i think everybody is confused here for entry. according to me in simple way forgot about the name of indicator 5 min alf or anything this makes confuse to everyone.
i think if u got chart as same in this thread ONE LINE WITH THICK BLUE LINE and ONE WITH THIN BLUE LINE
FOR
LONG..........1. all candle should be on above both lines i mean thick and thin blue line
2. for exact entry...
Ignored
thank you man
but I still hope to see chart a clear way