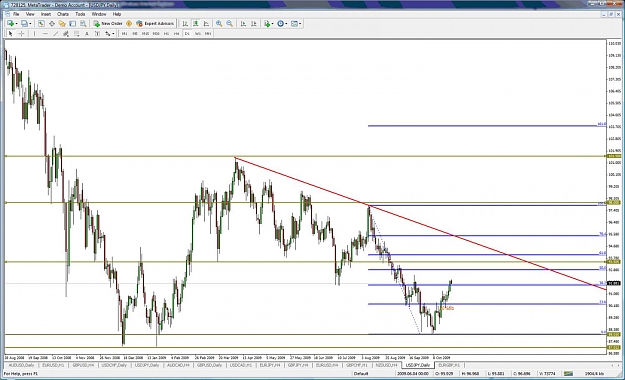
Hi dan, first congratulations on new baby. The usd/jpy has been bearish for some time as you can see i started to see an upward move and took a demo long @90.50 what i would like to ask is at what point do you start to change your bias after seeing either a bearish/bullish move using this method i have noted that the longer term 50%fib from the 97.77 mark would take us to the 93. mark where it could resume it's bearish bias hope you understand the question.Attachment
Ignored
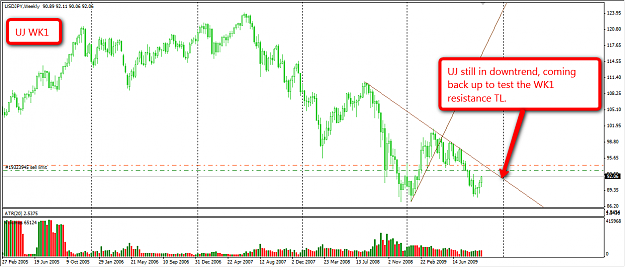
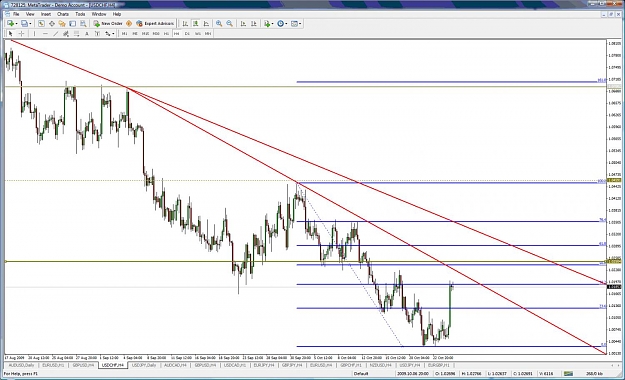
Castlerock, I realize you posted the question to Dan. Apparently, Dan is busy with his baby at the moment. If I may offer my observation. I'm presenting a Week 1 Chart and a Daily Chart to show you what I've been seeing for a few months. Start with the WK1 chart, which shows that UJ is in a downtrend. The apparent bull move you see is likely a retracement back to the WK1 resistance line shown in the WK1 chart.
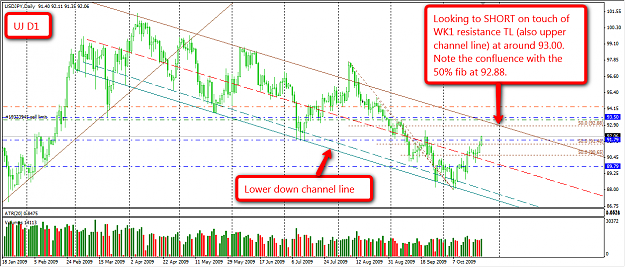
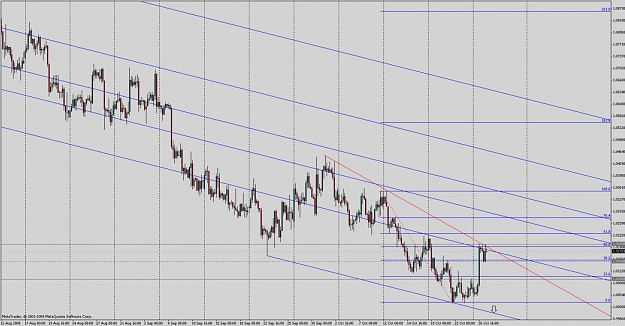
If you go to the D1 Chart you'll see a down channel that started about March/April of this year. I've been using it to trade UJ. It has held up pretty well. Similar to you, I'm looking for it to go back up to somewhere around the 93.00 area where we should have a confluence of the WK 1 support TL (which also forms the upper channel line) and the 50% fib at 92.88. I'm planning to SHORT this here myself.
Castlerock, I realize you posted the question to Dan. Apparently, Dan is busy with his baby at the moment. If I may offer my observation. I'm presenting a Week 1 Chart and a Daily Chart to show you what I've been seeing for a few months. Start with the WK1 chart, which shows that UJ is in a downtrend. The apparent bull move you see is likely a retracement back to the WK1 resistance line shown in the WK1 chart.
If you go to the D1 Chart you'll see a down channel that started about March/April of this year. I've been using it to trade UJ. It has...
Ignored
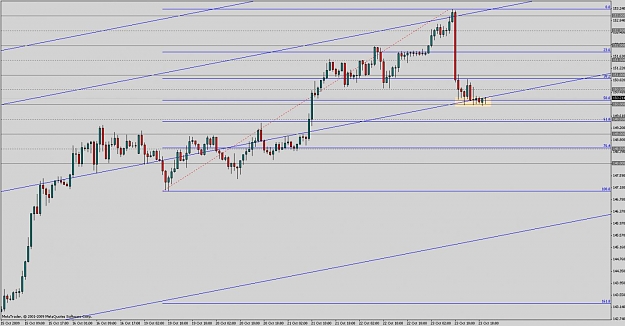
Hi ricky yes I'm looking at the same thing as you it is a bit of a counter trend tread i have taken here i seen what was a bit of a bullish move and had been eying the 93 mark for a sell thought there might be a couple of hundred pips in this if it gets to the 93.00. 93/50 is where i will look for a short if it breaks 93.50 then it could go to 98.00.
Hi ricky yes I'm looking at the same thing as you it is a bit of a counter trend tread i have taken here i seen what was a bit of a bullish move and had been eying the 93 mark for a sell thought there might be a couple of hundred pips in this if it gets to the 93.00. 93/50 is where i will look for a short if it breaks 93.50 then it could go to 98.00. Attachment
Ignored
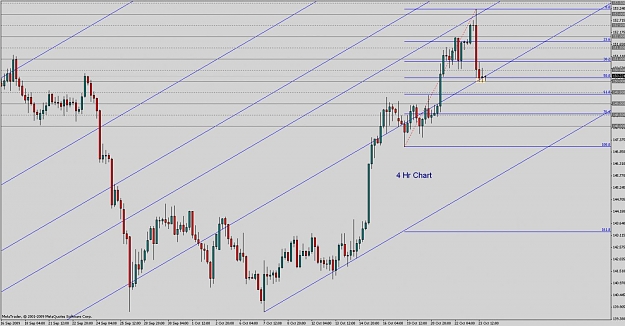
Yes, I have 93.50 as a key area as well. It's noted on the chart I posted as a dashed blue line. I'm waiting because I hate counter trend trades.
Hi ricky yes I'm looking at the same thing as you it is a bit of a counter trend tread i have taken here i seen what was a bit of a bullish move and had been eying the 93 mark for a sell thought there might be a couple of hundred pips in this if it gets to the 93.00. 93/50 is where i will look for a short if it breaks 93.50 then it could go to 98.00. Attachment
Ignored
Hi Castlerock, I like your fib set-up on the charts, any chance you could post one similar. 93.50/98.00 are key areas, excellent stuff.
Im looking at a possible entry at 1.0500 since it didnt hit 1.0600.
what do you think?
Also keeping an eye on U/J.
What do you think of G/U? It didnt reach fib 50 nor 1.6200 but it did hit 1.6250. the only concern id have is the massive pin formation on the weeklies chart...
|
Joined Nov 2006
|
Status: very junior member
|1,576 Posts
i already have a pending sell at 1.5 on usdcad.
on U/J i am already long from 91.5 but thats using a different system, and on that system i have a fixed exit.
on G/U, i had a pending buy at 1.625 but that didnt get triggered on my platform (oanda). the next level i will be watching is 1.64 which is the 50% from high of 5/8 to low of 13/10
in addition i have closed my long on audusd from 0.922 for 50 pips. i manually closed this since i was not comfortable with the price ranging on audusd. for now i will stay out of audusd.
another pair which is strongly trending and that is on my watch list is usdnok, however i will not recommend that pair to newbies because of the high spread and leverage.
Im looking at a possible entry at 1.0500 since it didnt hit 1.0600.
what do you think?
Also keeping an eye on U/J.
What do you think of G/U? It didnt reach fib 50 nor 1.6200 but it did hit 1.6250. the only concern id have is the massive pin formation on the weeklies chart...
Hi Castlerock, I like your fib set-up on the charts, any chance you could post one similar. 93.50/98.00 are key areas, excellent stuff.
Ignored
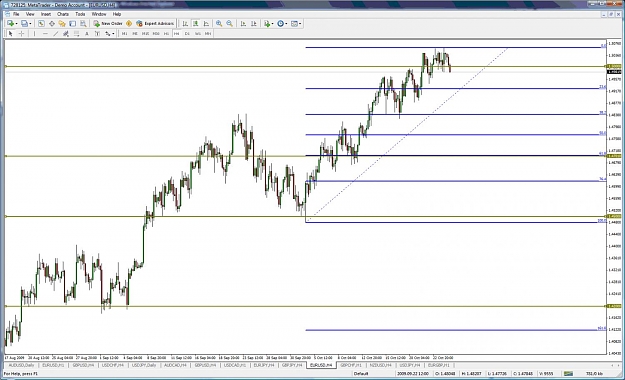
Hi kingdomk, don't know if this is what you mean but this is what i have set up on the Eur/USDA at the moment with the 1.4700/50 area marked with interest also in the area of the 50%fib but we will see what happens if it gets there.
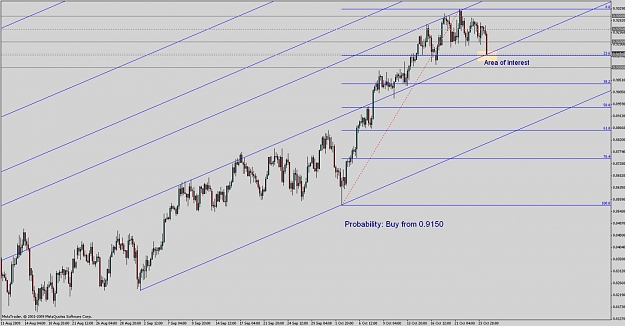
Keeping my eye on the AU, price is hitting 0.9150 (round number) and an inner trendline along with the 23.6% profit taking fib level from a larger move up. I have a buy from 0.9150 alert in place.
Until I see some interaction around this area, it is still just an area of interest, finger off the trigger at the moment.
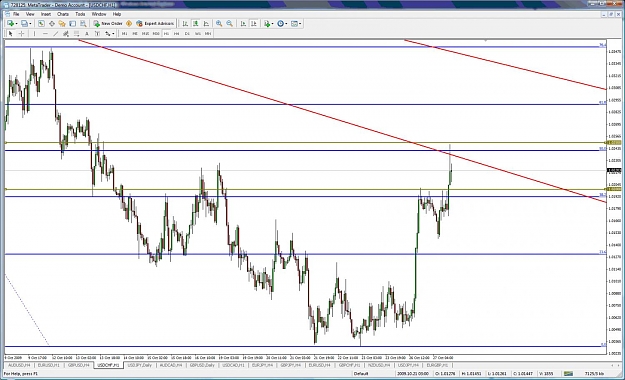
hi coolshades looking at usd/chf again dstryr has a good point of entry on his chart which is in keeping of this method but that was a very bullish h4 bar/candle and a strong daily bullish close so I'm going to hold off at the moment and see if we get a longer pull back to around 1.0250.
USD/CHF trending down, an area of interest for me was 1.0200 where price stumbled, it is also a 50% retrace of the move from 12th October and in the vacinity of a trendline, price did move down to 1.0150 (50 pips) where a possible sell entry was available, just after hitting this target it moved back up to an area of interest but failed to close above the trendline. I'm assuming it will continue its move down to at least the outer trendline, somewhere in the region of 1.0000.
(4 hr chart posted)
I see where your reasoning for a later entry stems from, taking your fib from the 1st Oct gives a 50% retrace at around 1.0250/1.0200