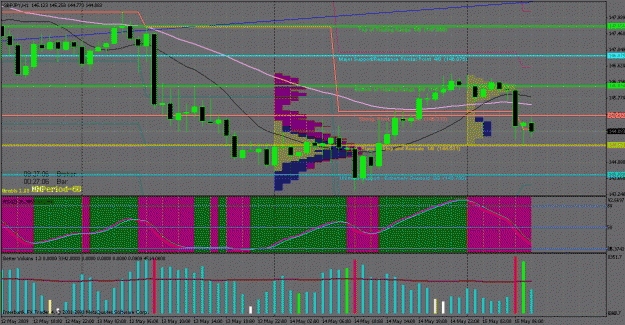
if we are bearish, we get a substantial volume on a down bar closing on the lows. however on the next bar, we can wide spread up bar that closes just above the open.
so if we were previously bearish (in the background), how could that be a shakeout (high volume). that's what i'm confused. or what that just a distracting signal?
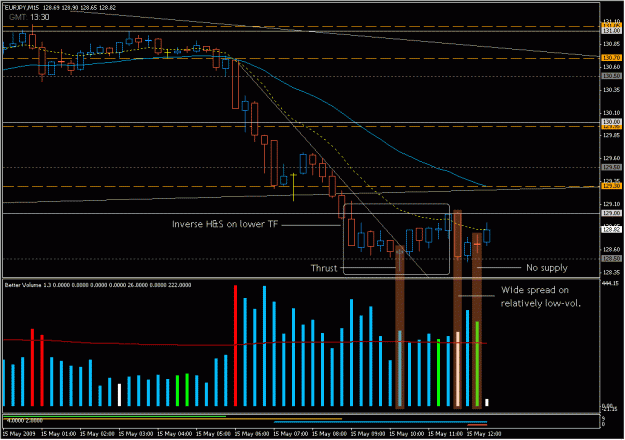
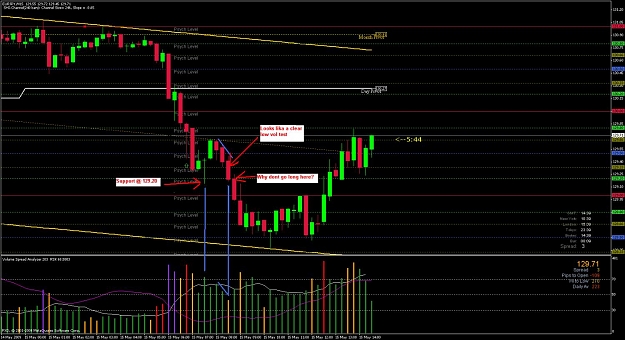
here is a entry i spotted in EJ 15min (thanks magnus )
This looks like a clear "low vol. test" of 129.20.
Well, the price goes South
Why? Maybe its the bearish background.
here is a entry i spotted in EJ 15min (thanks magnus )
This looks like a clear "low vol. test" of 129.20.
Well, the price goes South
Why? Maybe its the bearish background.
here is a entry i spotted in EJ 15min (thanks magnus )
This looks like a clear "low vol. test" of 129.20.
Well, the price goes South
Why? Maybe its the bearish background.
Have a nice weekend!
Ignored
bbartha,
One of the things I have learned to look for to confirm a valid test is a high churn bar. I rationalize it by thinking that if the spring (or upthrust) is a vaid turning point, at some point the big money has to change direction. This should be evident in a high churn bar. I am no expert, but I have been watching a lot of charts and analysing springs and upthrust. Although it's not 100%, waiting for the high churn after a spring or upthrust has worked very well for me.
here is a entry i spotted in EJ 15min (thanks magnus )
This looks like a clear "low vol. test" of 129.20.
Well, the price goes South
Why? Maybe its the bearish background.
Have a nice weekend!
Ignored
Any testing of the market that does not immediately respond with higher prices is an indication of weakness. The test bar closed near its lows and the next bar carried on straight down. There was very little to no retracement. This is a failed test of the market.
You need to wait for a confimation of a test to see if the professionals are stepping in.
Joined Mar 2008
|
Status: Lord of the Dance
|659 Posts
Here was an easy A+ trade yesterday on GJ
-Volume and Price Divergence (Decreasing Vol on a down move is Bullish)
-Price and RSX Divergence
-Buying in the Background
-Major Support Line (Dotted Purple Line) on 4H TF
-Pin Bar
|
Joined Mar 2009
|
Status: Never Give Up! Persistence Pays$$
|144 Posts
Here is a link to a pdf called "The Ultimate Trading Guide" which I think has excellent information on how to identify accumulation/distribution, reaccumulation/redistribution, price action, VSA trade setups. It's worth checking out.
Here is a link to a pdf called "The Ultimate Trading Guide" which I think has excellent information on how to identify accumulation/distribution, reaccumulation/redistribution, price action, VSA trade setups. It's worth checking out.
Joined Mar 2008
|
Status: Lord of the Dance
|659 Posts
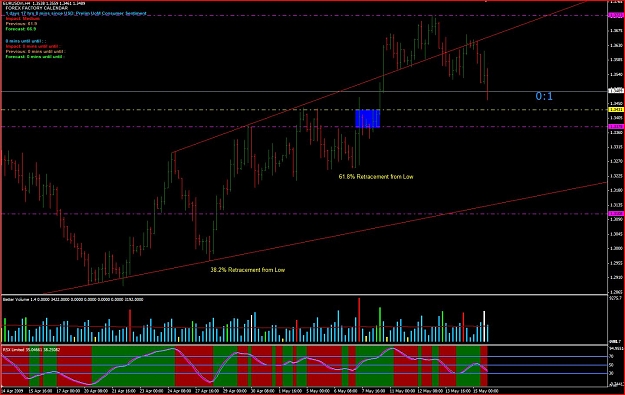
I posted this in the No Brainer Thread but thought it has significance here too.
The yellow dotted line is significant support on the 4h EU chart.
It is also the 38.2% and 61.8% retracements from the Higher Lows marked on the chart (Almost to the pip)
The blue area was a previous area of very high volume. This will add to the support of that line. There could be a significant amount of traders who sold in the area and are trapped in a bad trade. They will buy back as soon as price returns so they can exit their trade for little or no loss.
This will drive price back up.
To break through this support line the market makers/professionals will need to mark down prices rapidly on high volume. Watch price on a lower timeframe to see how it approaches this line.
Here is a link to a pdf called "The Ultimate Trading Guide" which I think has excellent information on how to identify accumulation/distribution, reaccumulation/redistribution, price action, VSA trade setups. It's worth checking out.
I posted this in the No Brainer Thread but thought it has significance here too.
The yellow dotted line is significant support on the 4h EU chart.
It is also the 38.2% and 61.8% retracements from the Higher Lows marked on the chart (Almost to the pip)
The blue area was a previous area of very high volume. This will add to the support of that line. There could be a significant amount of traders who sold in the area and are trapped in a bad trade. They will buy back as soon as price returns so they can exit their trade for little or no loss.
This...
Ignored
Excellent post copi88...
Also, 1.3400 psych. number there as well (which is always a bonus!).