- <LI class=level1>Calculate the last period's Typical Price (TP) = (H+L+C)/3 where H = high, L = low, and C = close.
<LI class=level1>Calculate the 20-period Simple Moving Average of the Typical Price (SMATP).
<LI class=level1>Calculate the Mean Deviation. First, calculate the absolute value of the difference between the last period's SMATP and the typical price for each of the past 20 periods. Add all of these absolute values together and divide by 20 to find the Mean Deviation. - The final step is to apply the Typical Price (TP), the Simple Moving Average of the Typical Price (SMATP), the Mean Deviation and a Constant (.015) to the following formula:
CCI = ( Typical Price - SMATP ) / ( .015 X Mean Deviation )
I have been following the thread silently for a while because I like MA's and CCI. I will offer my advice and experience and leave it at that. I dont want to add indicators to the system but several people seem to be struggling on exits. As you become experienced you will know when to get out of a trade based on your own personal needs and comfort level but until that time you are looking for a mechanical approach, and thats fine.
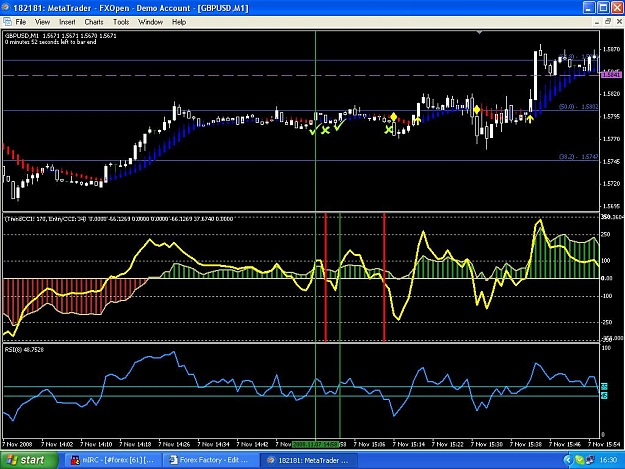
In the following screenshot I will offer two examples of an exit indicator and a possible filter. The first is the good old ParabolicSAR built into MT4 set at .035 and .2 That would be a good setting for a scalper but if you are in for a longer haul you may need to loosten up the settings a little bit. The other is Explosion Gold at the bottom of the chart. It is pretty self explanatory once put onto the chart but stock settings need to made a little more sensitive on the 1M chart. Just play with it a little and fine tune it for each pair. Both indicators have the possibility of being an entry filter as well, just use your brain a little and you can figure it out.
My following thoughts are on the Fibopivots and S&R. Look, all S&R is self fuffilling prophecy-PERIOD. It works because there are thousands of traders seeing the same level on their charts, thats why it works. The horizontal lines represent profit targets, stop losses and entry points. The more people, and the more money that can see these lines, the more price will react. Fibonacci doesnt work on small time frames especially when the fibo pivots are nothing more than a fibo sequence from the pivot line. How many banks and institutions do you think are using fibopivots? Ill tell ya- none. The only fibos they are using are from a 1 hr chart up, usually more, and have nothing to do with the pivot. They use them from there because the high and low is far less subjective meaning many more traders will see the same line and react to it.
S&R does work on small time frames drawn off the 1m chart as previous highs-lows, I use it every day. Again, the reason it works is because everyone can see a high or a low and draw a line there and use it. I wont go into how and where as it is an entire thread in itsself. A lot of traders do use pivots and midpivots, also camarilla pivots, psych levels like any .000 or .50 level is an area to watch. I will attach indicators that draw them in history so you can see for yourself if you must have an autodrawn line. The best S&R however is off larger timeframes that you clearly see yourself. All the noobs here should do yourself a favor and go read BilyRayValentines thread-No Braner Trades.
See the reaction to the first horizontal line(green) a brief pause, then a push through to the 1.2800 congestion area as bulls/bears fight for dominance(line not there-oops) then right up to the 1.2850 to the pip and right back to the midpivot line(green) for a quick pause before the battle begins again for dominance.
Again, please dont take this as another method, just my observations of an already solid one with a slightly different approach and visualization. I have attached the indicators discussed except PSAR which is standard.