the notation here is what i currently trade as my system. if i stretch out my stops (which are usually 100's of pips) and cut my winners with 50 pips tp's then i can approximate something similar to what you do anyway, so it was quite easy for me to pick up.
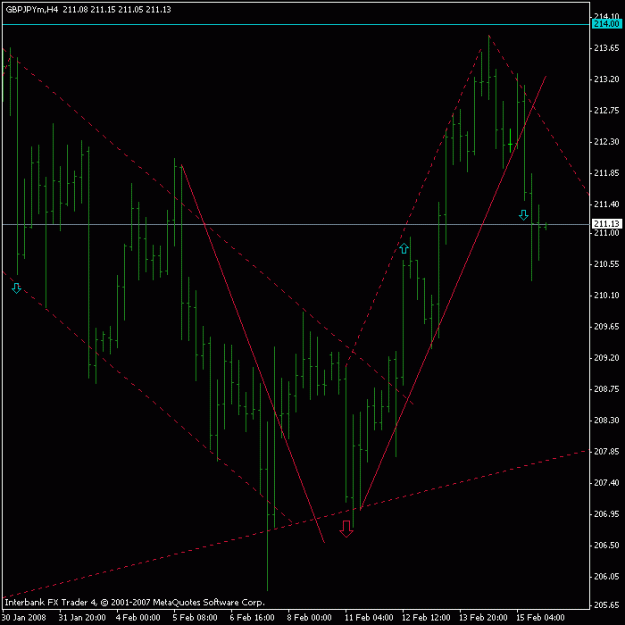
the solid lines are trade lines for which i would follow simple, large scale breakout signals (blue arrows).
so you can see the current blue arrow would normally be a sell for me (i don't trade this pair normally).
take some time to digest the chart. if you look at the first arrow (far left) then the drawdown can be quite large at first (hence wide stops) before i can pick it off with a trade line (solid line).
the second blue arrow is a trade that works quicker and the third blue arrow is where we are at right now.
my question just concerns the big RED arrow only (next post)...
Attached Image (click to enlarge)