Ermm, that is m-1, not m1. My m1,m2,m3,m4 seems to be cut off. I already saved it using metatrader, but somehow it didnt show the full screen.
Ignored
Okay. I comprehend you.
Where does he state that 44 points should be used??? Surely the number of points/waves on a chart, as well as the point m1 is taken from doesn't affect our ability to apply the theory?
It is a common mistake by wave practioners to attempt analysis using a daily chart covering years and years. Accurate analysis requires attention to detail. The more detail a chart contains (that is, the more monowaves present), the more difficult detailed analysis becomes.
For accurate wave analysis, you want to limit the complexity visible on a chart to between a Fibonacci 34 and 89 monowaves, with the ideal being around 55. Charts that contain 100`s of monowaves will cause one to miss the subtleties required for good analysis and charts with less than 34 monowaves may not contain enough information for a reliable conclusion.
Where does he state that 44 points should be used??? Surely the number of points/waves on a chart, as well as the point m1 is taken from doesn't affect our ability to apply the theory?
Ignored
Go to neowave website, and read the past question of the week.
I think this is the latest or is it the other way around?
Quote
Disliked
This is a "complexity related" question sent in by a client in South Africa. Ideally, all charts used for forecasting are constructed with cash data and plotted in NEoWave fashion (i.e., with the high and low in the order they occurred). Outside of the stock market, most bar charts are futures based or have expiration dates (i.e., they are not cash based). If a bar chart is all you have to work with, the time frame you are following (whether hourly, daily, weekly, etc.) is not what determines the number of bars that should be visible. As always, the focus should be on the complexity of the chart (i.e., the number of monowaves visible).
When working with a high/low NEoWave chart, the ideal number of monowaves visible should be about 44. To see 44 monowaves on a NEoWave chart requires from 22 to 33 groups of high/low data (i.e., the highs and lows extracted from 22-33 bars). When you use bars instead of a NEoWave plot, the complexity of the chart is cut in half (since the high and low occupy the same space). Therefore, to create the same complexity on a bar chart as on a NEoWave chart, you need twice as many bars. Consequently, instead of needing 22 to 33 bars, you need about 44 to 66 bars of data visible to do accurate wave analysis on a bar chart.
Ok, you guys are NEVER going to understand NEoWave or Elliott Wave for that matter if you continue trying to learn the way you are.
1.) You will not be able to predict 100% what the market is going to do.
2.) The wave indicator you are using is off and counts some monowaves improperly, misses some, and sometimes breaks a single monowave into multiple monowaves.
3.) You are suppose to skim through the book the first time. In fact, I would skip chapter 3 completely and read the rest of the chapters first. I have pages tabbed and labeled to revert back to.
4.) Chapter 3 to me, only helps me get out of very very sticky situations.
5.) Candles can be used because, in Forex, they show all price data. You don't have to draw lines if you are labeling your chart. You know that from the termination of wave-c, to the termination of wave-1..there is an imaginary line.
6.) I think those trying to use Neely should learn the basics from another book. I use Neely to confirm patterns and get an idea of what is going to happen by the different ratios he gives for each pattern. There's an important lesson on channeling
I've got more advice, but everyone in here seems like they know more than me
nice to see that so many of us use glenn neely´s book.
i gotta question: what data points do you use to plot the monowaves on your chart?
would be also interesting to see if someone really makes consistently money with it.
i think one great thing is to collect enough data and calculate the final average point from day to day. this way it is much easier to recognize the waves.
Ok, you guys are NEVER going to understand NEoWave or Elliott Wave for that matter if you continue trying to learn the way you are.
1.) You will not be able to predict 100% what the market is going to do.
2.) The wave indicator you are using is off and counts some monowaves improperly, misses some, and sometimes breaks a single monowave into multiple monowaves.
3.) You are suppose to skim through the book the first time. In fact, I would skip chapter 3 completely and read the rest of the chapters first. I have pages tabbed and labeled to revert back to.
4.) Chapter 3 to me, only helps me get out of very very sticky situations.
5.) Candles can be used because, in Forex, they show all price data. You don't have to draw lines if you are labeling your chart. You know that from the termination of wave-c, to the termination of wave-1..there is an imaginary line.
6.) I think those trying to use Neely should learn the basics from another book. I use Neely to confirm patterns and get an idea of what is going to happen by the different ratios he gives for each pattern. There's an important lesson on channeling
I've got more advice, but everyone in here seems like they know more than me
Ignored
No one here can say they are the "Neowave expert" so please share.
I agree that Neowave should not be studied until you have a good understanding Of E.W first.
I was reading the book this last week on vacation (when I found time) and yes chapter 3 should be skipped and go straight to chapter 5 and on.
You should still read CH3 but don't get hung up on it cause you'll get frustrated and give it up. So is there anyway to get a proper indicator that does CH3 for us? That would be great.
I agree. I use the same indicator that is listed above, but it is off quite a bit. I use chapter 3/4 to help get out of sticky situations, but otherwise..I don't really mess with it.
Reflecting on Neely's method of defining waves, I think that using the candlestick or bar high/lows already on the chart actually allow for a better interpretation of the movements in the market.
With regards to Neely's book, I finished it a while ago, and am using it as a reference, as well as to remind myself of the more subtle observations he makes. Once I got over the initial hurdle of chapter 3, it was a nice but frustrating read (for the reason that he hasn't written it as a cover to cover book, but instead makes constant reference to pages in previous and future chapters).
Further, I don't think one should strictly adhere to the nuances Neely points out, but rather make use of them as guidelines when attempting to decipher the wave patterns before you. The most important things are the Essential Rules, and to a certain degree the Conditional Rules. I particularly liked how much detail he placed on describing the numerous complex corrections that the markets tend to draw out in the latter chapters.
I think it is truly exciting how closely the markets pertain to wave theory. It is presently a challenge for me to correctly interpret wave counts on a consistent basis, however there are times when it has been a complete success. For instance, I found myself trading the 1-minute GBPUSD the other day with astounding accuracy. Though monthly, weekly, and sometimes daily charts are extremely difficult to read at times.
just my 2 cts... you will likely only be able to use his theory if you manual trade or skip it. Its a time consuming read and I think although the classifications of waves
are good, ---the time factor both in learning his classification system and using in the markets is extraordinary high. Also, I believe this type of trading fails in that it doesnt really factor market times in any real manner. A dead spot is not a wave! .Read it all,,, and ditched it.
Hello everyone, I'm studying Neely's book "Mastering Elliott Waves" for almost 2 months, this is my first approach to EW and the first book I study about EW. I stopped my advance at chapter 8 because I recently faced some difficulties reassessing compacted patterns. The problem is that I dont know what to do next if during the reassessment Pre-constructive rules of logic suggests to put structure labels that contradict to compacted pattern's base structure label.
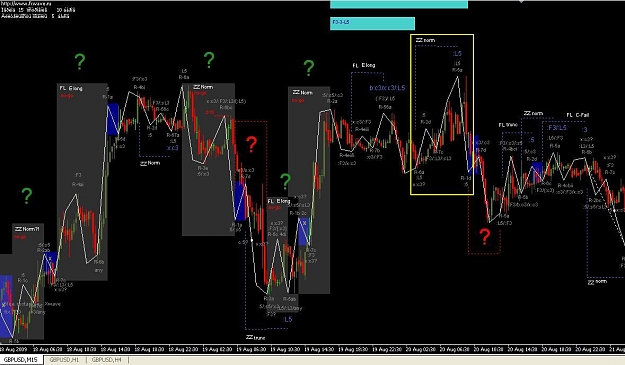
(an example is attached) - there's a strucuture series marked with yellow rectangle, according the structure series placed on those monowaves, it's a Zigzag, then additional rules were implemented to confirm wether it is true or not. in this case it is a Zigzag so for further analysis this pattern must be reassessed - we must run it through the Pre-constructive rules of logic once again but this time the whole pattern should be conceivable as one wave (monowave). So I find difficulties deciding what to do next if Pre-Constr Rules suggests labels which contradict to patterns base sturcture label. (in this case I compacted Zigzag which base label will always be :3)
I hope to have some discusion with you all about this.
If You have any Qs, feel free to ask me, I'll try to answer all of them which relate chapters 1-7 (inclusively).
Hello everyone, I'm studying Neely's book "Mastering Elliott Waves" for almost 2 months, this is my first approach to EW and the first book I study about EW. I stopped my advance...
Ignored
me too study Neely's Mastering elliott waves. me to encountered the same problem.
Does anyone who study his book wants to participate in discussion?
in order to get things more clear for others to understand, I add an example where my problem is the same as :c3's. The strucuture series is accentuated by yellow rectangle