{quote} Hi hdn Hope you are well. If you gonna make an indicator with low usage pockets, can i suggest to create it on a high timeframe like Robin Mesh explain it. And also to create data points to extract it to an excel sheet, like the Composite profile from bandan. Thanks El
Ignored
that's a good idea
the best thing is to connect the mp with excel
{quote} Hi hdn Hope you are well. If you gonna make an indicator with low usage pockets, can i suggest to create it on a high timeframe like Robin Mesh explain it. And also to create data points to extract it to an excel sheet, like the Composite profile from bandan. Thanks El
Ignored
Hi Kelowkie,
sure i try make it ,
I still don't understand this system properly
Of course, I try very hard and I'm sure with your help, I will finally get the result.
I will write the program
As soon as I understand this system.
If you need help. just quote me ^.* I will come soon.
Hi Kette,
I know your familiar with pivots and MP
I use this pivot indicator which gives you midpoints and pivotRange high/low
Also you can enable Fibots - Fibs with Pivots - confluence
You can change timeframe
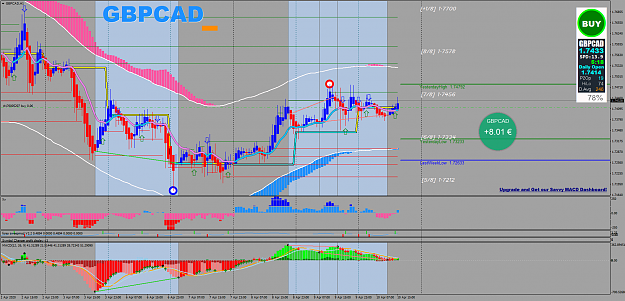
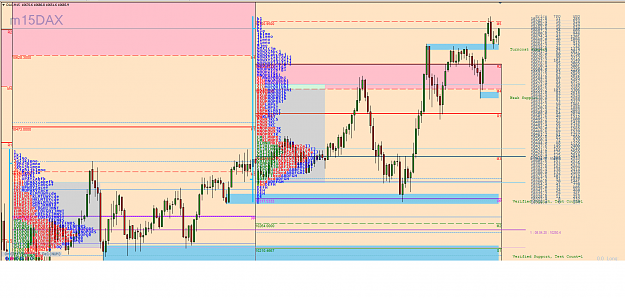
Hi Kette, I know your familiar with pivots and MP I use this pivot indicator which gives you midpoints and pivotRange high/low Also you can enable Fibots - Fibs with Pivots - confluence You can change timeframe {image} {file}
Hi Kette, I know your familiar with pivots and MP I use this pivot indicator which gives you midpoints and pivotRange high/low Also you can enable Fibots - Fibs with Pivots - confluence You can change timeframe {image} {file}
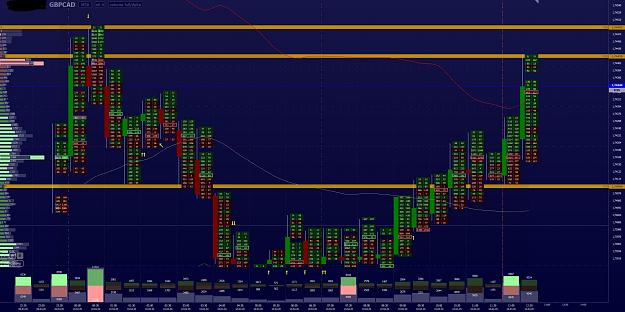
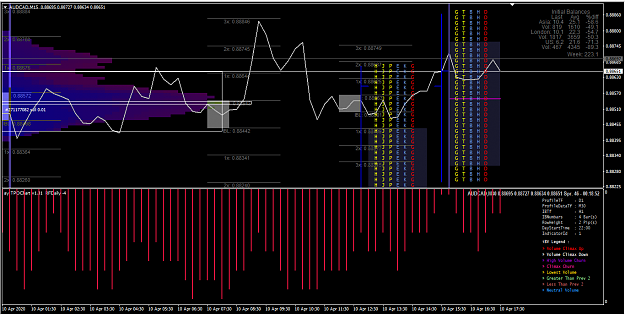
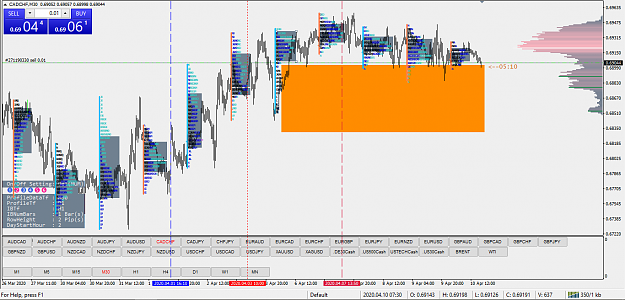
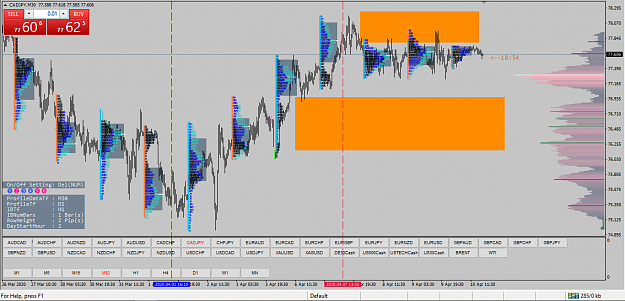
{quote} Hi again Mate. Could it be possible to create a tool showing M30/H1/H4 low pocket usages like on the screen with lines? As far as i read you have coding skills. Maybe it is possible Thank you. Below screen shows the low pocket usages on H1 See how price reacted with up & downs until it was balanced. And after the balancing process (zone 2) completed, it striked through the gap 3 zone. Maybe it will stay in that zone many days for balancing (re distibution / re accumulation of smart money) and will decide where to go. {image}
Ignored
my dear friend
In order to be able to write a program, I must first be able to find the relevant areas correctly.
So
I try to identify the relevant areas by sending photos
Please tell, whats the story of them big puppys .....
In the next step, I will turn these findings into robots.
If you need help. just quote me ^.* I will come soon.