Not new to FF but first post in this thread. Thought I would also join in the discussions here. Been at it for a while. Always up down up down with much cash blown. Trying again on real @ 1:100. I have given up all indicators, trend lines patterns etc. and any long term movements. Only using Weekly, daily and h4 and hourly for levels with entry adjustments at lower time frames. Try to hunt only 20 to 30 pips or similar SL levels. After staring at candles like a zombie for years i feel the levels i point out most times coincide with pivots and S/R etc. So would love some inputs here too on my levels. Anyway my next entry short with 30 pip SL & TP. my SL tp never a writing in stone i move them around constantly until i close the trade either manually or with TP.
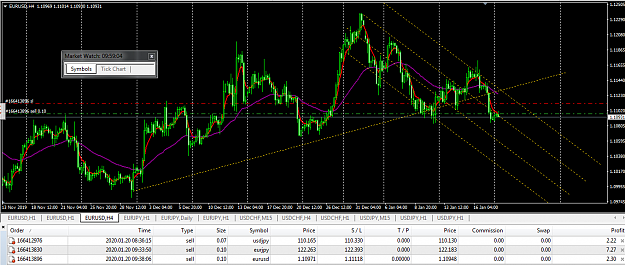
Sell limit at 1106 just below latest order accumulation on friday.
Hello All, Not new to FF but first post in this thread. Thought I would also join in the discussions here. Been at it for a while. Always up down up down with much cash blown. Trying again on real @ 1:100. I have given up all indicators, trend lines patterns etc. and any long term movements. Only using Weekly, daily and h4 and hourly for levels with entry adjustments at lower time frames. Try to hunt only 20 to 30 pips or similar SL levels. After staring at candles like a zombie for years i feel the levels i point out most times coincide with pivots...
Ignored
Maybe you should consider trading with a lower leverage? 1:30? 1:10? At least until you make consistent profits.
Except that, welcome!!!
My pre-day indicators say BULLISH so maybe today I will be able to close the bad positions from Friday...
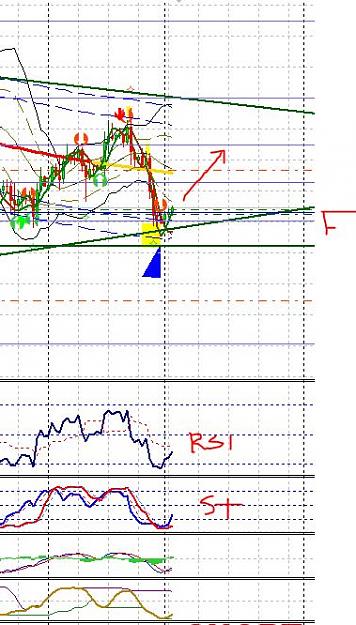
{quote} sure is ,, is neckline wiped yet? ,, and where might an attempt come from? and what time might tht happen ? lol how much farther above daily pivot is weekly pivot ,,, all little questions one might ask themselves,, think the folks tht sold in the circle held over weekend ,,, and where is the last level the mkt showed tht got sold ,,, what pattern ya got in white circle on a small chart ? {image}
Ignored
just to add the calendar for EUR .. tomo germany ZEW (last 4 times hv beaten) + ECB thurs (imp as they might revise their cpi target range so can be mkt moving) .. with eur sitting right at key support lvls.
{quote} Maybe you should consider trading with a lower leverage? 1:30? 1:10? At least until you make consistent profits. Except that, welcome!!! My pre-day indicators say BULLISH so maybe today I will be able to close the bad positions from Friday...
Ignored
For me leverage is not very material because i dont worry for left over margins as i trade 1 position at a time and EU only at more or less the same risk capital. If i change my leverage ill simply change my order volume to take the same risk for the same pips. 1:100 is simply easier to calculate since its a dollar a pip at 0.1 lot
{quote} just to add the calendar for EUR .. tomo germany ZEW (last 4 times hv beaten) + ECB thurs (imp as they might revise their cpi target range so can be mkt moving) .. with eur sitting right at key support lvls.
Ignored
I hear ya ,, who wants to sell support , well I mean besides retailers lol,and thts tomorrow correct? there will be 30 to 50 pips today ,, where is res besides last level mkt pointed out roughly where todays pivot is ,, guess one now knows why there is a daily pivot there ,, funny how tht works ,, Fridays mid point where? ,,, m30 200 Where? hourly 200 where? even the ole 4 hour 200 ,,where? Neckline not broke ,, this is not really a res area ,, caught the top Thursday ,, one probably gonna watch about half the gains dissipate,,, then what does London do and does the usa add too er or then take a crack at the ole neckline same ole game just another week starting
{quote} sure is ,, is neckline wiped yet? ,, and where might an attempt come from? and what time might tht happen ? lol how much farther above daily pivot is weekly pivot ,,, all little questions one might ask themselves,, think the folks tht sold in the circle held over weekend ,,, and where is the last level the mkt showed tht got sold ,,, what pattern ya got in white circle on a small chart ? {image}
Ignored
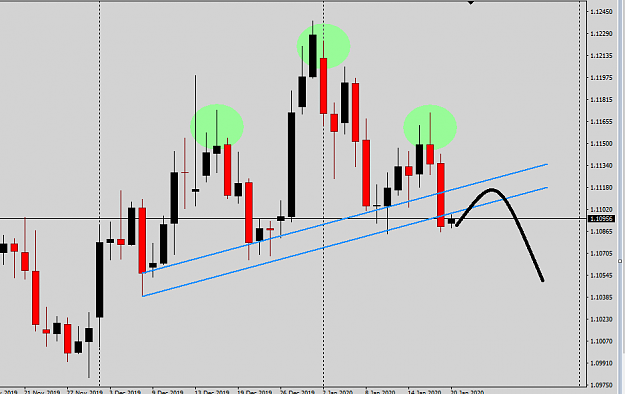
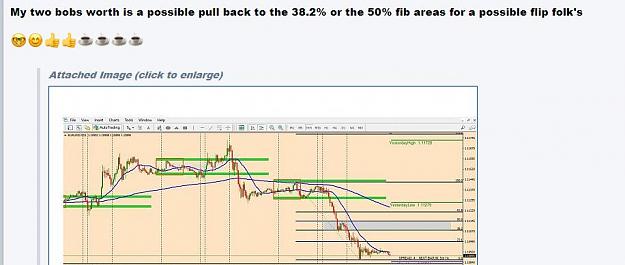
Ha Digs,
Welcome back my friend,that area is the 38.2% -- 50.0% fib flip area.
Or you could also call it a 1.2.3. patten
As I posted way back https://www.forexfactory.com/showthread.php?p=12709692#post12709692
Ah we can name it whaterver ya want ,, Dingo man do ,, lol,, like cat man do ,,,, not really back yet ,, looonnng ways from my cp ,,, but did borrow a laptop for my down time (much to the disdain of my wife) lol,,, trying to help my wife s uncle ,, uncle no neck Guido get on the strait and narrow lol,, before I get whacked over here
My take is to go long.
there are just too many at this point.
Currently, price is at Fib 61.8 level, and it is on longer term trend support line as well as bouncing from lower ATR band.
In addition, when ever RSI is bounce off from 25, there will be strong bounce.
Hi everyone,
With the downside of the daily candlestick closing down, I was looking for a good entry point PRZ for the fall today.
After the price reached the bullish correction levels, I found the area less comfortable and entered T.F M15.
I think this fall continues this week to the third trend line in TF H4.
Hello All, Not new to FF but first post in this thread. Thought I would also join in the discussions here. Been at it for a while. Always up down up down with much cash blown. Trying again on real @ 1:100. I have given up all indicators, trend lines patterns etc. and any long term movements. Only using Weekly, daily and h4 and hourly for levels with entry adjustments at lower time frames. Try to hunt only 20 to 30 pips or similar SL levels. After staring at candles like a zombie for years i feel the levels i point out most times coincide with pivots...
Ignored
Yes.Weekly and daily trend can give long sideways good time to waste money.about trend we will see 1.10600 its a daily bollinger.after it down i dont know.
Joined Aug 2012
|
Status: Fundamental & Technical Analyst
|1,905 Posts
Gamblers batter the dollar and get beaten back
FX traders have sold a huge amount of dollars over the past eight months, but it's rallied and now stands on brink of its strongest level in the past 21 months. Between April 2019 and the end of the year, traders sold $19 billion and the trade-weighted value of the currency rose 0.9% .... That bullish situation has been eclipsed this year in some style – the dollar's value measured by the DXY index has risen 1%. Traders have sold a further $11.6 billion. While it's a relatively poor measure of the dollar's value, being overweight euro, if DXY gains this year were added to those for the real trade- weighted value of the dollar at the end of 2019, its value would be around 119 .... The 2019 high for the dollar was 119.46. The net long position is now only $1.5 billion dollars. The lack of longs heightens the chances of a much bigger rally. Copyright 2020 Thomson Reuters.
So what does it mean for our EU Bulls???
Happy Trading
Trades on fundamentals that enforce technical moves
Joined May 2014
|
Status: Full Time Trader
|22,315 Posts
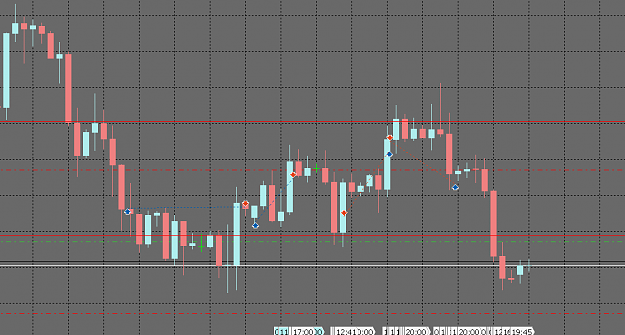
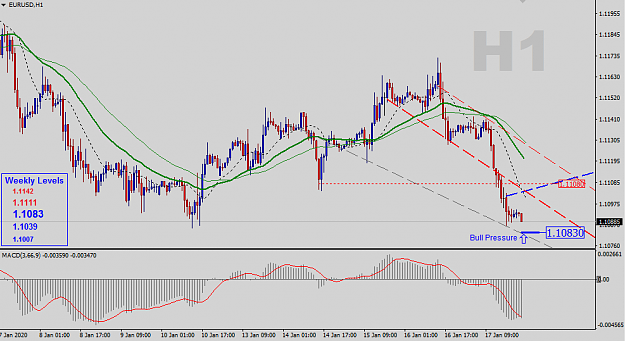
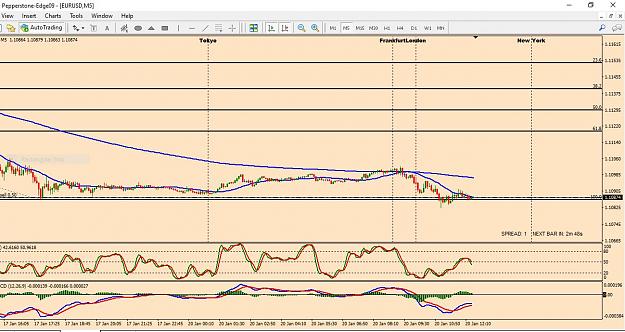
H1 Status Update
Nothing has changed and not much to do so I have not even updated my chart: 1.1083 is still nearest support.. If some of you already have bought this level good luck
H1 Status Update Nothing has changed and not much to do so I have not even updated my chart: 1.1083 is still nearest support.. If some of you already have bought this level good luck Stay Green {image}
Gamblers batter the dollar and get beaten back FX traders have sold a huge amount of dollars over the past eight months, but it's rallied and now stands on brink of its strongest level in the past 21 months. Between April 2019 and the end of the year, traders sold $19 billion and the trade-weighted value of the currency rose 0.9% .... That bullish situation has been eclipsed this year in some style – the dollar's value measured by the DXY index has risen 1%. Traders...