{quote} Does the bullish HD on the NZDCHF 4 hour matter at all?
Ignored
ROEye,
NZDCHF is an interesting case, I will give you my thoughts, others are welcome to do so:
I usually consider patterns in higher timeframes to be stronger than the ones in lower timeframes. Here we have a HD pattern on the Weekly chart, which is the highest and it tells us that price has a chance to reverse and go to the down side. That would be in sync with the positions of the two Ki jun lines I use to have an idea of the bigger picture. As a matter of fact, we can see that on the Monthly chart, the trend is down and we are likely at the end of an upward retracement. Furthermore, price is at a significant Fib number and a reversal downward would make sense (although nothing is guaranteed). It is then justified to look for entry signals, and we need more than the HD pattern and the Fib number.
Switching to the lower Daily chart, we see another sign, a bearish regular divergence pattern. At this step, I usually wait for the cross of a trendline and the MACD cross of its zero line. Neither has occurred so far. We can wait for them to happen, but we also can consider the divergence pattern a the starting point to go further down and see if there are entry signals on the 4 HR chart. To me, regular divergence can be traded the same way as hidden divergence.
On the 4 HR chart, there is another regular divergence pattern. That makes three bearish divergence patterns on three different timeframes, so I would be very much surprised if price decides to go up. It's not impossible, but unlikely to me. Here, aggressive traders could have entered at the cross of the trendline with the steeper slope and price already reached a RR of 1:1. But I prefer to be more patient and wait for MACD line to cross zero. As you pointed out, the MACD histogram is showing hidden divergence to the upside, but the pattern is not completed and it is likely that price will continue down and invalidate that pattern. If price decides to cross the lime trendline up, you can enter a long trade because you will have enough room for a RR=1:1 before reaching the next resistance level.
We'll see what price will do. If price crosses the second trendline and MACD crosses zero, that will mean the start of a Trading Zone and I would wait for MACD signals in the zone on the 30 min chart. That's the way I like to trade. We often see contradictory divergence patterns when we switch timeframes, but the best thing to do IMO is to stick to your rules and try to minimize your losses. But looking at higher timeframes is a good start.
|
Joined Feb 2018
|
Status: Trader
|49 Posts|
Online Now
[quote=chamane;12681728]{quote} so I would be very much surprised if price decides to go up. It's not impossible, but unlikely to me.
Don't be, there's always sl hunting, and in the coming days, with the low volatility, anything can happen. just check the flash crash on 02.01.2019. but overall i very much agree with your pov
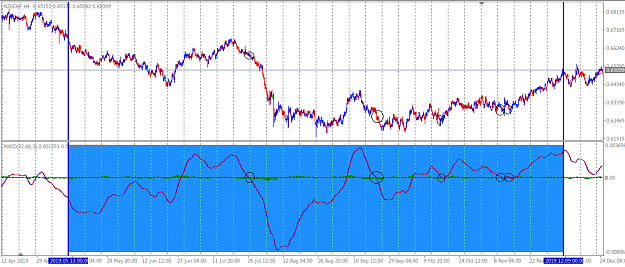
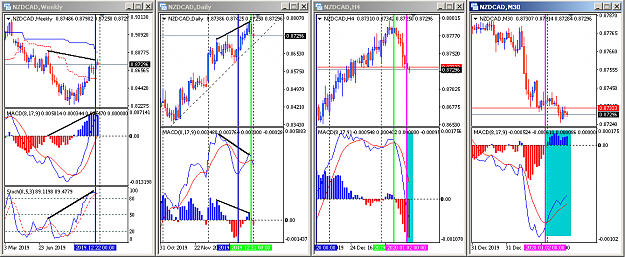
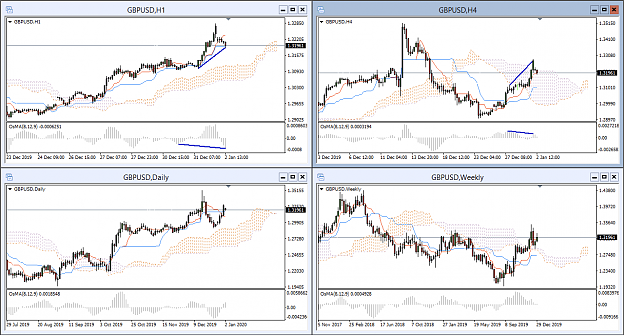
What do you think? My plan to enter if the H4 price manages to break the Kijun line. Also, the price is under the H4 Cloud. But, 1. on D1 the price is above the cloud but still under the Kijun & Tenken line. 2. on Weekly the price is near the cloud and below the Tenken line. {image}
Ignored
Dfn,
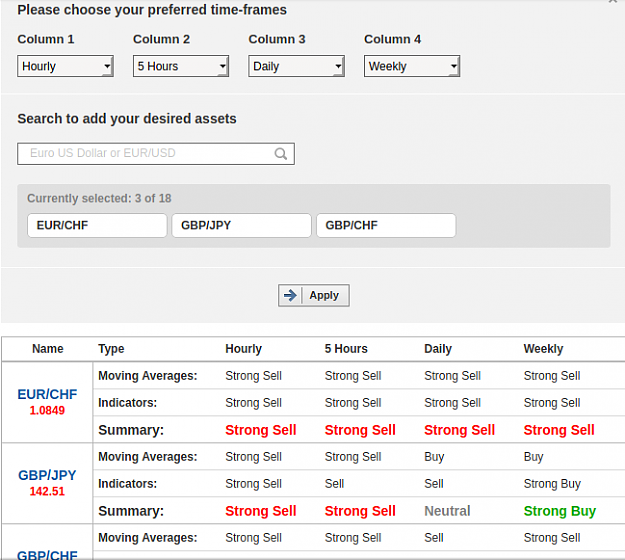
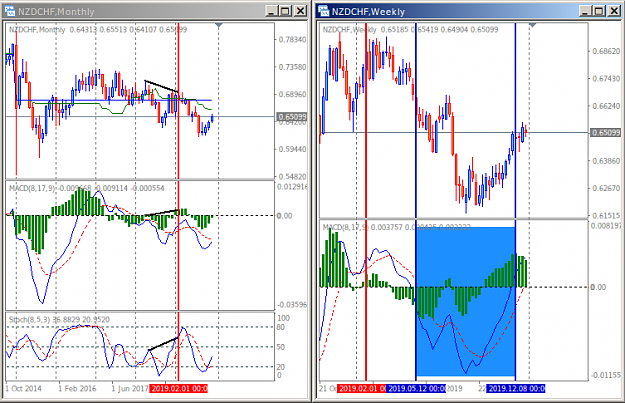
I don't use the Ichimoku for my trading, except for a few components. I think that Dany is a far better trader than I am with it. Since you refer to the trend, I will give you a tool that I discovered recently.
Go to that link and you will be able to see if the trend is going the same way on different timeframes.
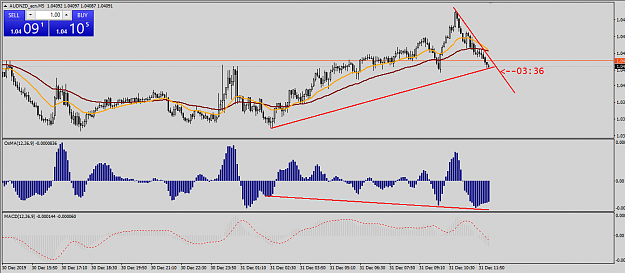
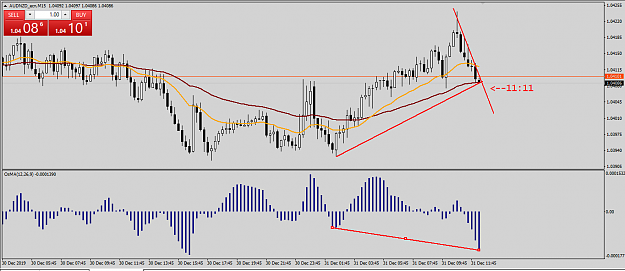
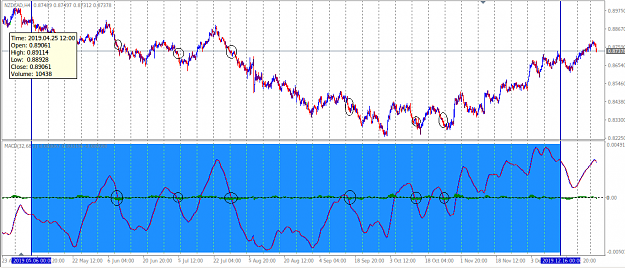
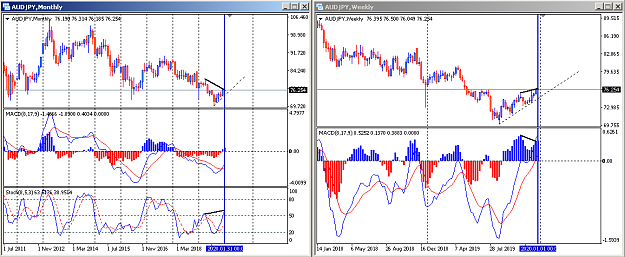
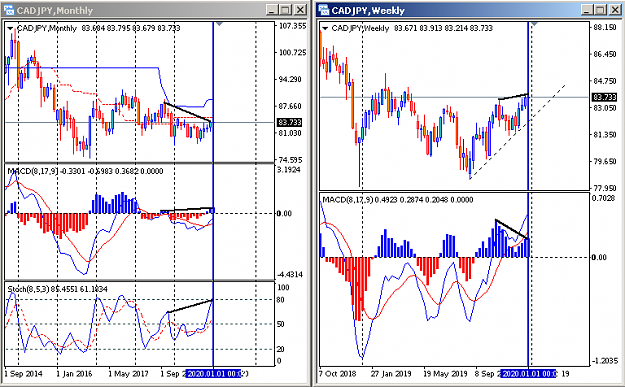
I wait cross trendline and long....really good signal in my book i like hidden divergence ; In my opinion, it's one of, if not the most powerful signal in trading. {image} {image}
Ignored
Seems to be a trend following style by nature. But, if I may ask, can it be Stochastic instead of MACD? Also, can I ask how long you've been trading this strategy?
Thnx for your interesting thread anyway and happy New Year
{quote} Dfn, I don't use the Ichimoku for my trading, except for a few components. I think that Dany is a far better trader than I am with it. Since you refer to the trend, I will give you a tool that I discovered recently. Go to that link and you will be able to see if the trend is going the same way on different timeframes. Hope that helps. {image}
Ignored
Thank you so much Chamane for the Tools. Will consider your information and tools.
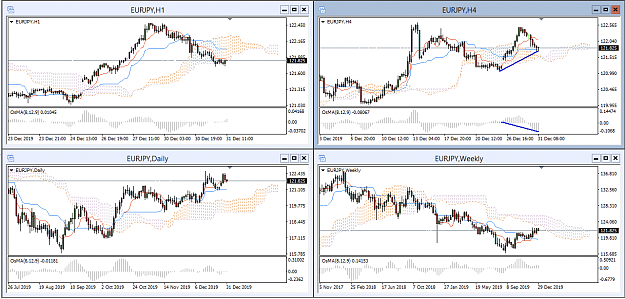
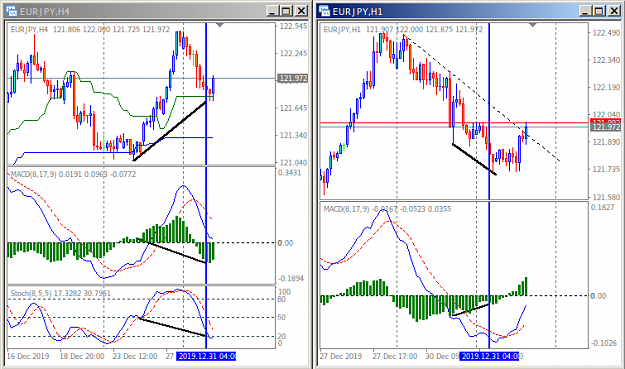
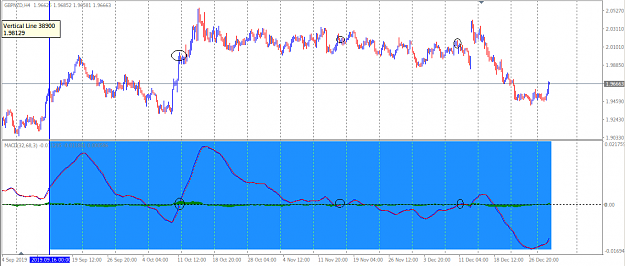
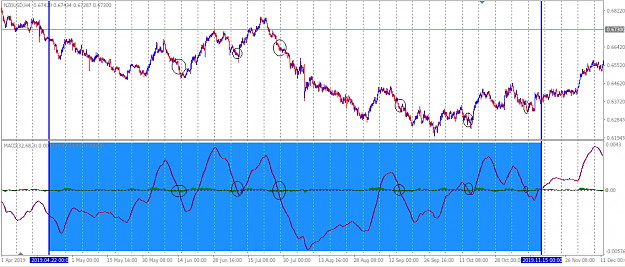
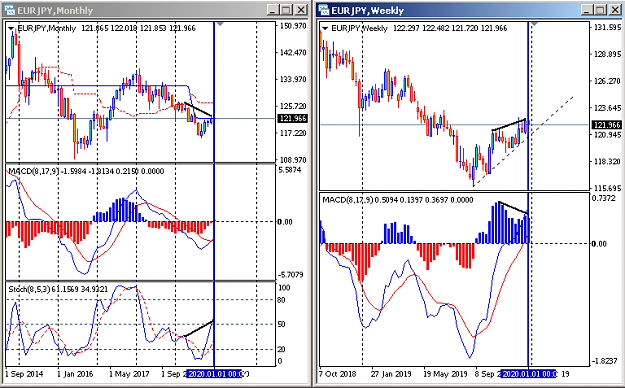
Anyway, what do you think about EJ. I see HD on the H4 Chart and hold by the Kijun (Resistance).
{quote} Thank you so much Chamane for the Tools. Will consider your information and tools. Anyway, what do you think about EJ. I see HD on the H4 Chart and hold by the Kijun (Resistance). {image}
Ignored
Looks like it wants to go up anyway. Personally, I wait for MACD to cross the zero line on the lower TF. But banks are all closing today. I would stay on the lines. There will be tons of opportunities next year.
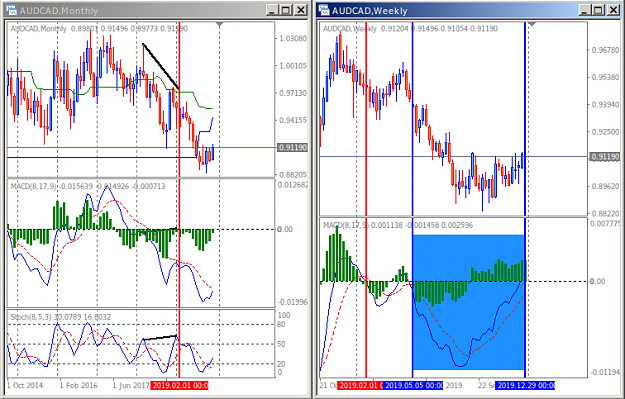
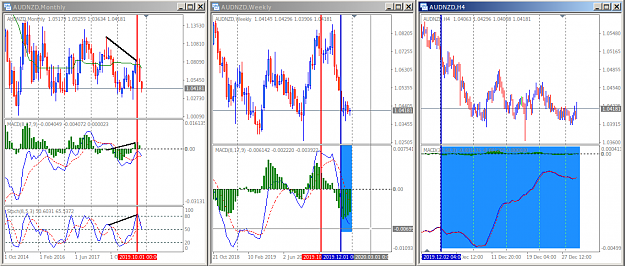
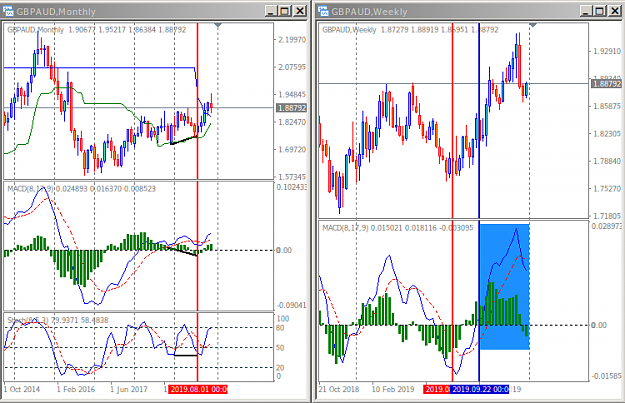
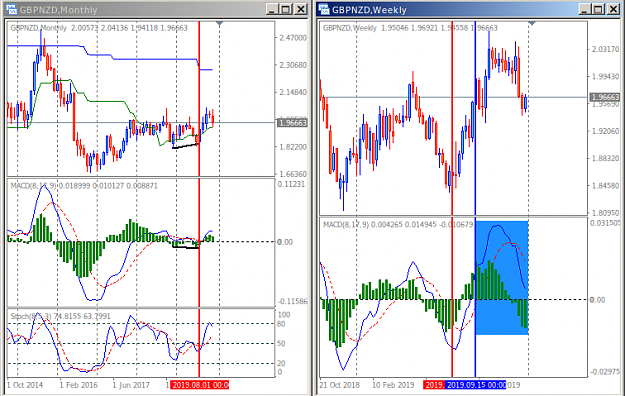
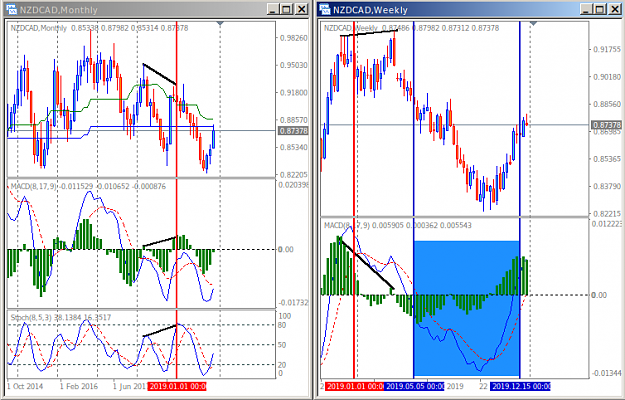
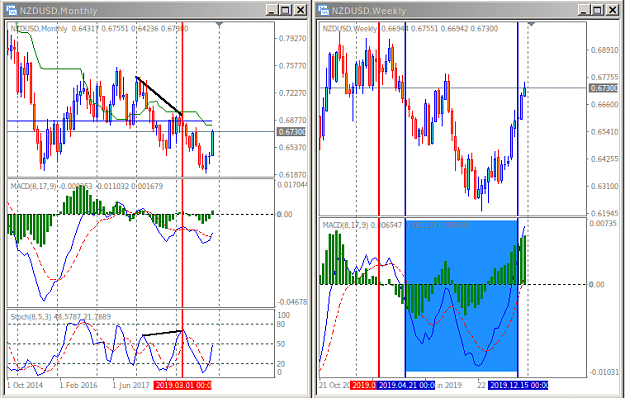
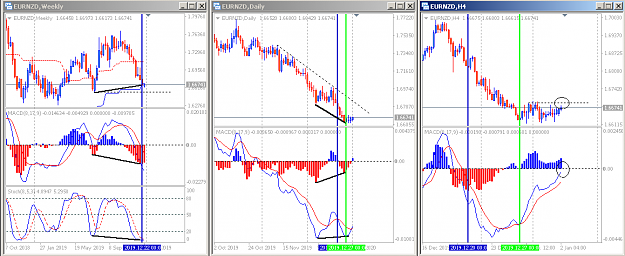
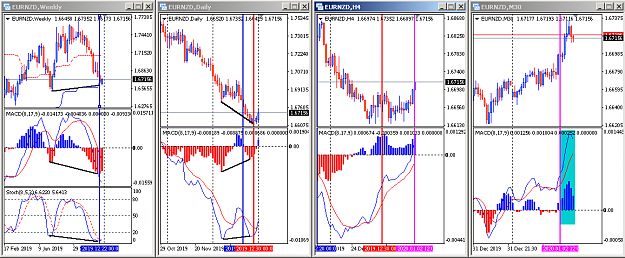
I used to post backtests of the 4HR charts after each week. At the end of 2019, I find appropriate to give an idea how hidden divergence performed during the year on the Monthly charts. There are more than one way to manage trades, I prefer to switch to a next lower timeframe and wait for the signal of an indicator, signaling the start of a Trading Zone. Then I drill down again to a much lower timeframe and wait for entry signals in the Zone. I usually bring my stop loss to breakeven when price reaches half the risk. With a RR = 1:1 and monitoring all 28 currency pairs, here is how it looked in 2019:
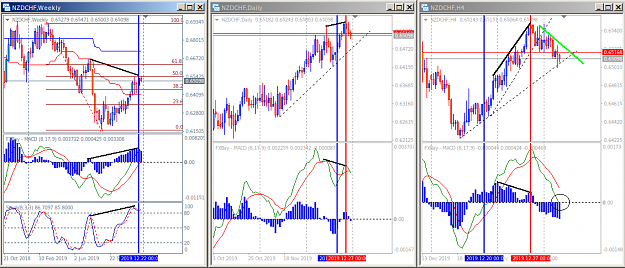
A HD pattern on the Weekly chart (blue vertical line).
A regular divergence pattern on the Daily (lime vertical line).
Entry signal on the 4 HR TF or the start of a Trading Zone (pink vertical line).
Waiting for entry signals in the Zone on the 30 min TF (blue rectangle).
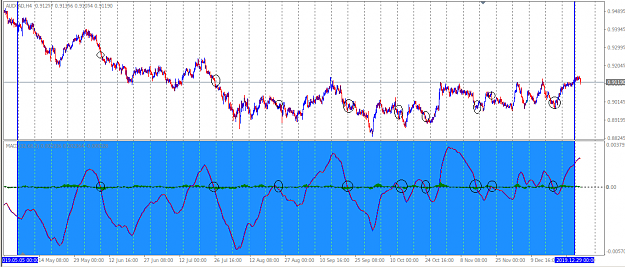
{quote} Hi Chamane, On the weekly Chart there is a Red Line and a Blue line. What is it?
Ignored
They are the middle lines of Donchian (26) and Donchian (130). You can also use the standard Kijun and a Kijun 5 times higher. It gives an idea of where the trend is going in a higher timeframe. It is better to look directly at the window though.
{quote} They are the middle lines of Donchian (26) and Donchian (130). You can also use the standard Kijun and a Kijun 5 times higher. It gives an idea of where the trend is going in a higher timeframe. It is better to look directly at the window though.