Here's what I see concerning the hidden divergence patterns on Weekly charts:
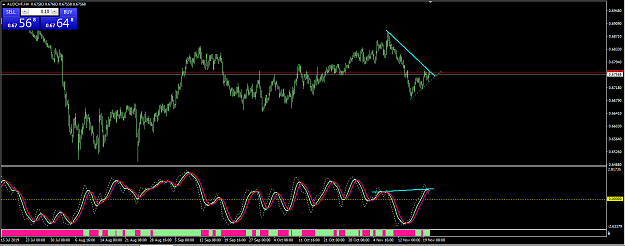
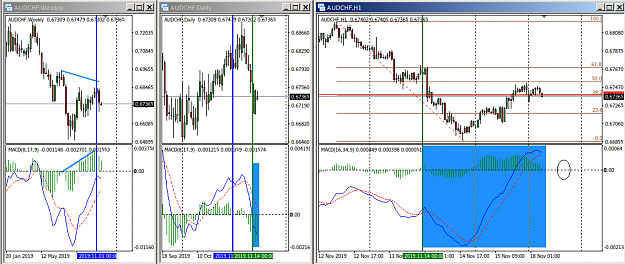
AUDCHF: HD pattern on Weekly. Entry signal on the Daily, but I prefer to use the signal for the start of a Trading Zone on the 2 HR chart. My first entry would be at the circle on the 1HR chart.
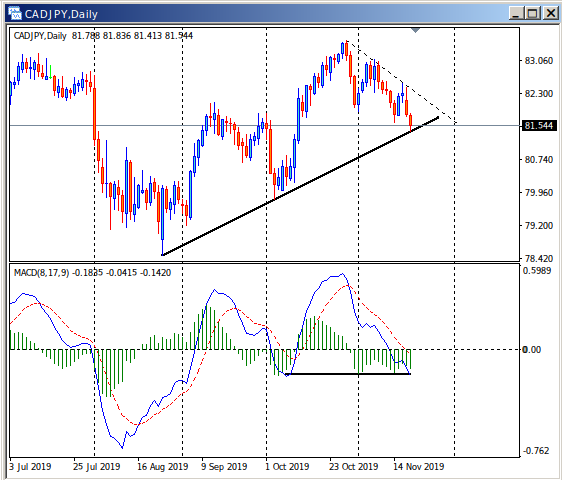
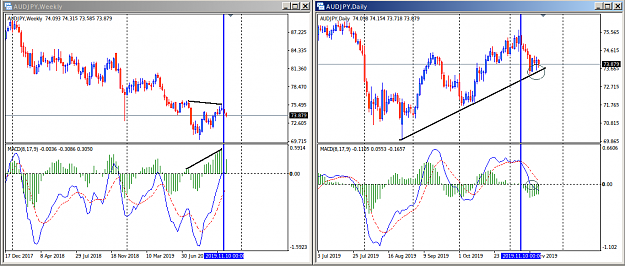
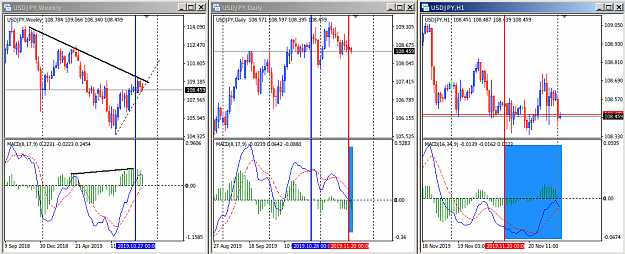
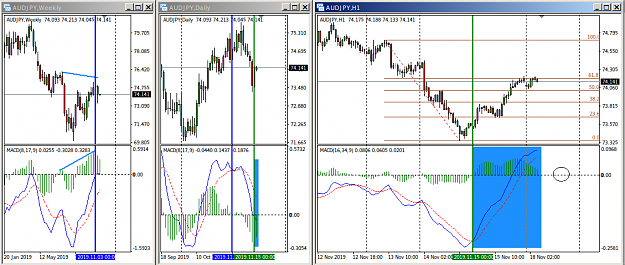
AUDJPY: Similar analysis. Note that price seems to be willing to go down after bouncing at a major Fib level (1 HR chart).
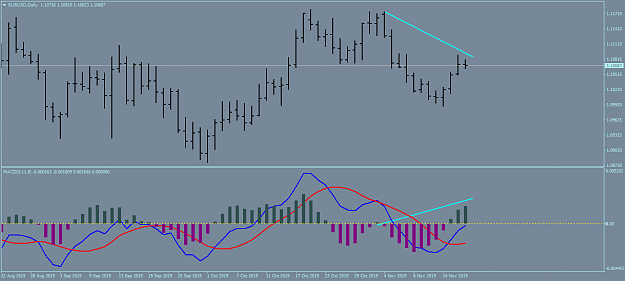
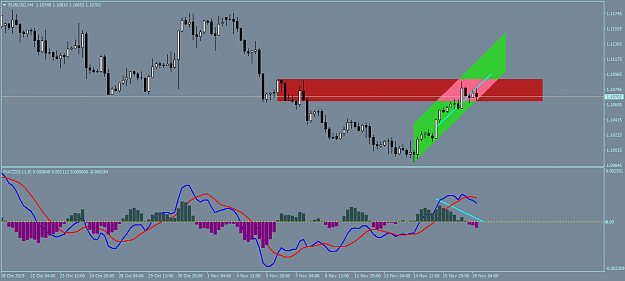
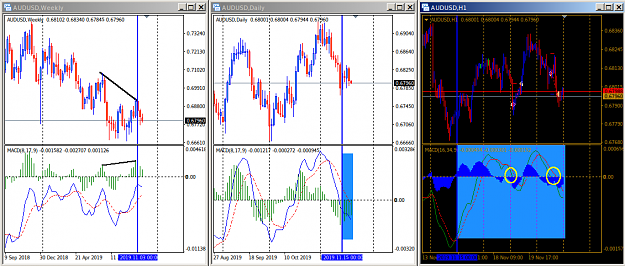
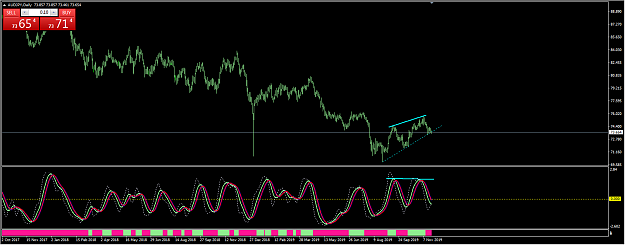
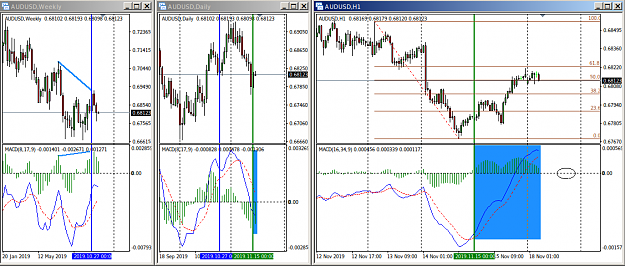
AUDUSD: Similar analysis and waiting to enter at the circle on the 1HR chart. I ajusted the MACD settings to simulate a 2HR chart.
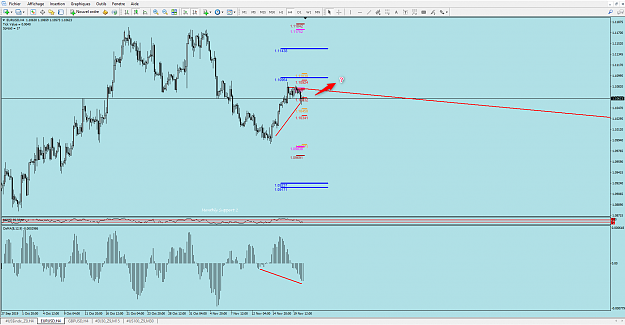
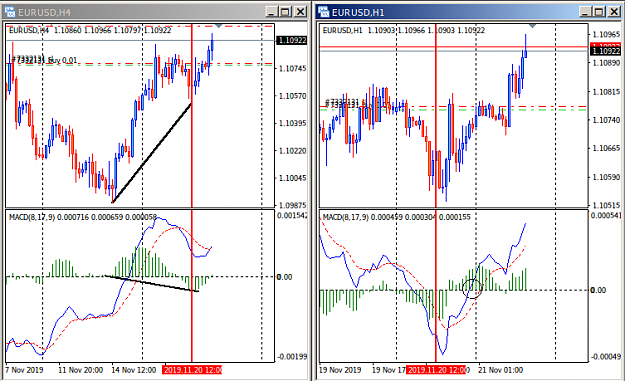
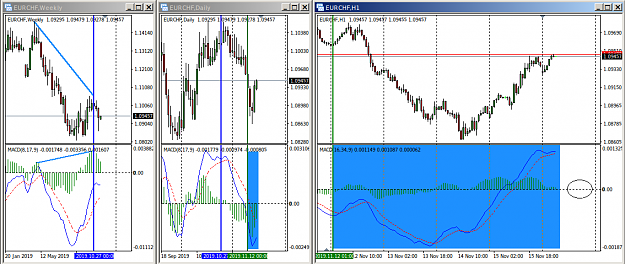
EURCHF: Similar analysis.
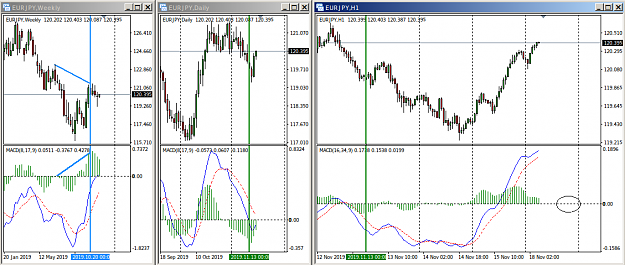
EURJPY: Similar analysis, but price seems to follow a strong upward trend.
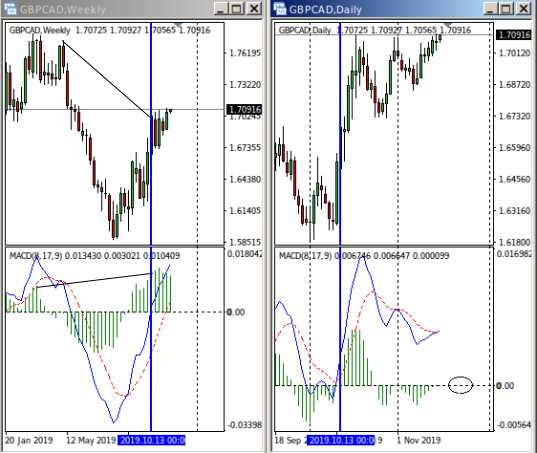
GBPCAD: Waiting for an entry signal on the Daily chart. At a triple top, but there is a strong desire to go further up.
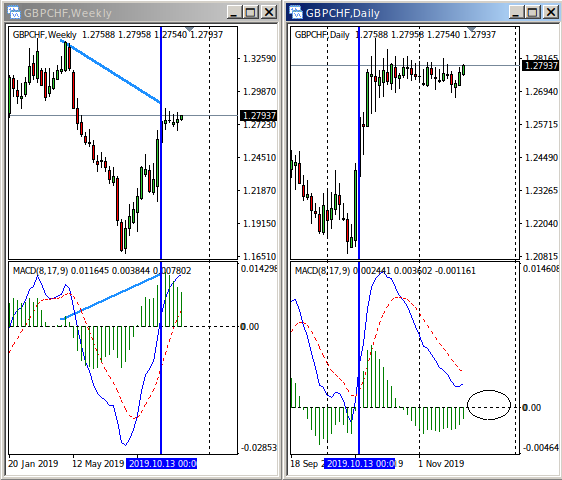
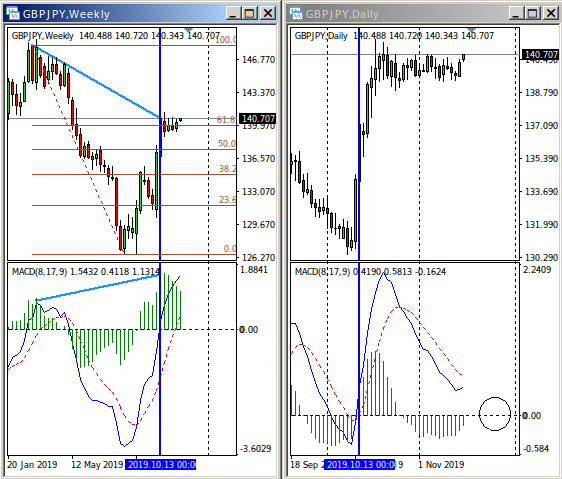
GBPCHF - GBPJPY: Waiting for an entry, but there is a strong indecision period in GB.
NZDCAD: Waiting for an entry signal, as with other NZD pairs.

AUDCHF: HD pattern on Weekly. Entry signal on the Daily, but I prefer to use the signal for the start of a Trading Zone on the 2 HR chart. My first entry would be at the circle on the 1HR chart.
Attached Image (click to enlarge)
AUDJPY: Similar analysis. Note that price seems to be willing to go down after bouncing at a major Fib level (1 HR chart).
Attached Image (click to enlarge)
AUDUSD: Similar analysis and waiting to enter at the circle on the 1HR chart. I ajusted the MACD settings to simulate a 2HR chart.
Attached Image (click to enlarge)
EURCHF: Similar analysis.
Attached Image (click to enlarge)
EURJPY: Similar analysis, but price seems to follow a strong upward trend.
Attached Image (click to enlarge)
GBPCAD: Waiting for an entry signal on the Daily chart. At a triple top, but there is a strong desire to go further up.
Attached Image
GBPCHF - GBPJPY: Waiting for an entry, but there is a strong indecision period in GB.
Attached Image
Attached Image
NZDCAD: Waiting for an entry signal, as with other NZD pairs.
Attached Image
2