Currency strength in the forex market
(You can download the described indicators at the end)
Hello dear traders,
The forex market differs from other financial markets at a very significant point: it consists of currency pairs. When you take a position, you trade two different currencies at the same time. This offers many interesting opportunities, as you can, for example, capitalize on your views on two economies with only one position. Therefore, it is difficult to look at the performance of a single currency in isolation.
Take as an example the EURUSD as a currency pair. If the price rises more in one day, there may be two reasons. The euro is particularly strong or the dollar particularly weak. It could well be that at the same time the euro is strong and the dollar is weak. There are different currency strength indicators with different calculation approaches.
Before I share my personal experiences, however, I would like to quote a few statements from Hanover. Hanover is a very experienced member of FF who enjoys a high level of acceptance and a very high reputation in this forum.
His statements about Currency Strength Meter:
But, assuming that there are no coding errors in the indicator calculations, accuracy is dependent solely on the price data being provided by the broker or market maker.
Which brings me to my next point(s). Firstly, all CSMs are derived from price, and price lags sentiment. In an industry where getting quickest access to quality information can provide a competitive advantage, institutional traders tend to use indicators that quantify sentiment, economic flows, orderflow/liquidity etc. (Many of these indicators are proprietary and lie beyond the scope of 'retail' charting packages like MT4).
Secondly, all price analysis is retrospective, and as price moves as waves within waves, this opens the door for arbitrariness that can only be resolved by selective bias. To explain with an example: the last 10 candles might represent an up-move, but these may be the most recent part of a larger sideways move, which in turn may be part of a larger down-move. Hence, like all other technical measures (e.g. moving averages, regression lines, etc), the price-derived CSM measure is determined arbitrarily by the historical horizon that's under study. There is no objective way of proving that one horizon is superior to another, that one way of calculating the value is superior to another, and hence that one CSM is necessarily superior in its 'accuracy' to another. All are ultimately giving a retrospective view of what price has done, and have no greater predictive value than price itself (or any other derivative of price).
Thirdly, predictive value comes down to the strength of the underlying sentiment which is determined by a number of fundamental reasons, many of which are economic, structural and/or logistical. If, for example, a CSM says that EUR is weak and USD strong, then the downtrend in EURUSD will continue only if there are overriding reasons -- i.e. reasons that underlie price -- causing it to do so. A price based CSM is not equipped to take these fundamental factors into account.
Fourthly, a CSM is merely a tool, and it is down to the trader, and how s/he interprets the strength/weakness measure, and uses it in the context of an overall trading system, that is an ultimate determinant in success or failure.
These statements from Hanover are important for now, before we take a closer look at individual currency strength indicators. Basically, I do not recommend spending money on a currency strength indicator. Within FF there are great traders and programmers who offer you different currency strength indicators for free.
More information is available at:
Recent Strength indicator
The different CSM indicators calculate the currency strength from the different currency pairs in the 9 available time units. Ticks are provided by the brokers, but not kept due to the high storage requirements. To calculate a currency strength in the tick chart, you would first have to generate all the currency pairs in the tick chart in order to derive a calculation from it. Thus a currency strength in the tick chart is not representable, because too expensive. In addition, a tickchart runs in the offline chart, which makes things even more complicated. Let us restrict ourselves to the 9 known time units in the MT4. I have tried different CSM indicators, which were also recommended by Hanover and use the following modules.
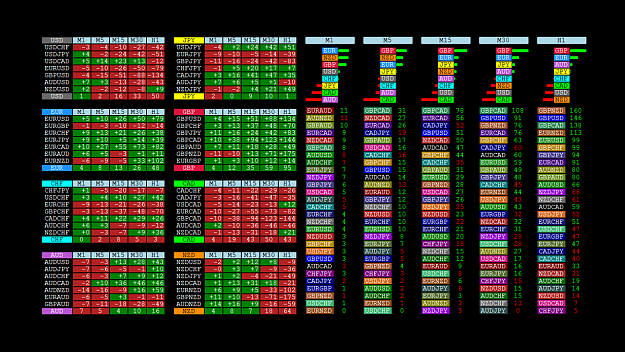
MADdash indicator, Developer: honestknave high impact member FF. A multi-timeframe dashboard calculated from the price. 8 currencies CHF, JPY, CAD, USD, EUR, GBP, AUD and NZD are compared. This gives rise to the strength of 28 currency pairs. Green means strength, red means weakness. Time frames are possible from M1 to MN. The indicator can be used individually. More information is available at:
MADdash (Moving Average Distance)
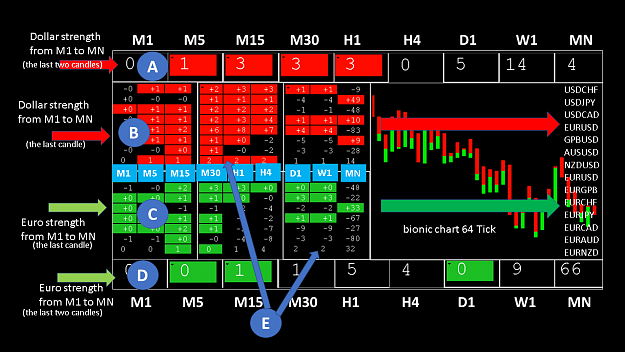
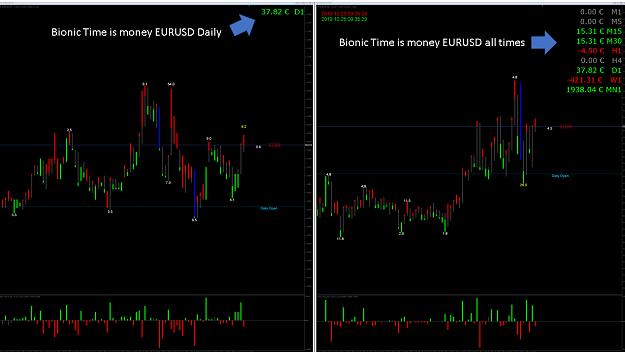
From the professional indicator of honestknave I have created an optimal representation for me. If the dollar is strong only a red color appears, if the euro is strong, a green color appears. With that I achieve a better overview for me.
Point A: In the upper red boxes, the strength of the dollar from M1 to MN is calculated against the following currencies: CHF, JPY, CAD, EUR, GBP, AUD and NZD. The last two candles are calculated.
Point B: In the red fields, the dollar moves from M1 to MN against the following currencies: CHF, JPY, CAD, EUR, GBP, AUD and NZD. Only the current candle is calculated. The lower field (Point E) is a summary of the 7 fields above. I have hidden this series in my current presentation.
Point C: In the green fields, the Euro changes from M1 to MN against the following currencies: CHF, JPY, CAD, USD, GBP, AUD and NZD. Only the current candle is calculated. The lower field (Point E) is a summary of the 7 fields above. I have hidden this series in my current presentation.
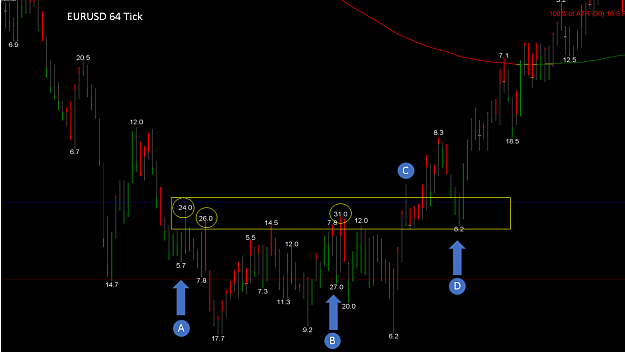
Point D: In the lower green boxes, the strength of the Euro is calculated from M1 to MN against the following currencies: CHF, JPY, CAD, USD, GBP, AUD and NZD. The last two candles are calculated. On the right is a bionic chart (64 tick) for the video overview.
The price is in a downtrend for the first 2 minutes, the strength of the dollar is clear. After 2 minutes slowly arises a euro strength, whereby initially the dollar is strong. The strength of the euro is increasing and the price is rising.
However, this type of ad is very short-term and therefore very volatile. It shows me very fast price changes, which are not always reliable. Basically, I warn against start a trade based on these views. In an ongoing trade, this can be very helpful at times to avoid getting out too early.
In addition, I also like to use the following indicators
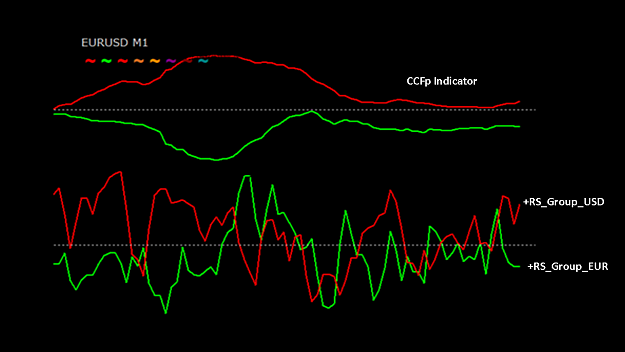
CCFp Indicator, Developer: SemSemFX, Interesting currency strength meter
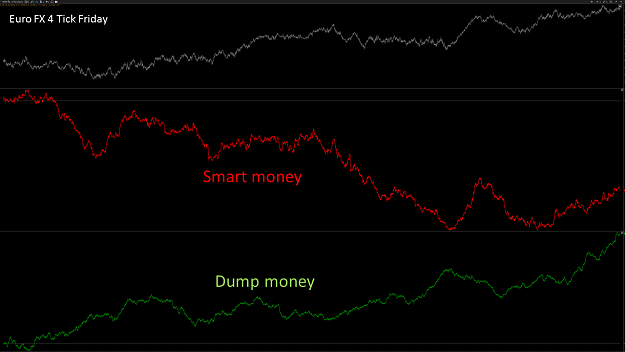
+ RS_Group EUR & USD indicator, Developer: unknown, Very interesting strength indicator that reacts faster than the price chart. Here, the euro was currently compared to the dollar.
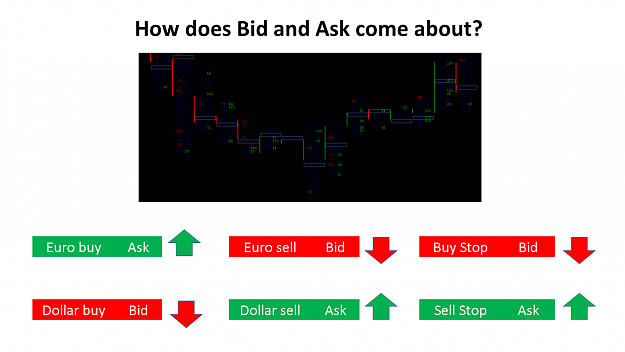
I recommend you to test these indicators during operation and to create your own interpretation. The big advantage of trading currency pairs is that there is a strength for the euro and the dollar, which often helps me identify what is happening in the market. However, this is no guarantee that this will remain so in the future. And for this we need the stock market data to detect possible absorptions in bid or ask. The Forex market is all about gaining an information advantage over most market participants.
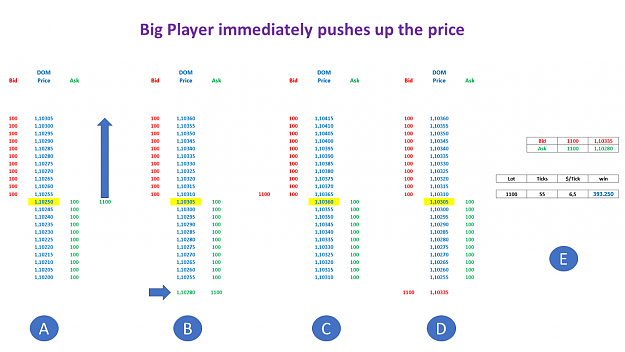
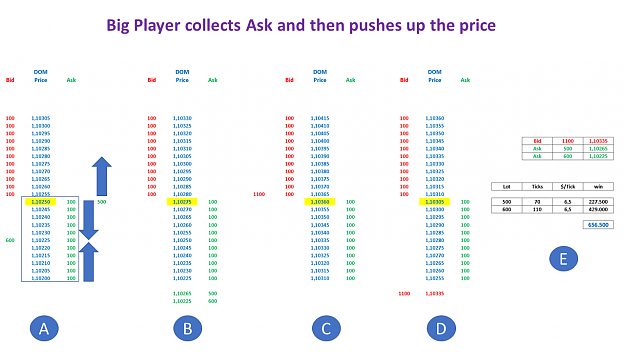
If you identify the retail traders you usually have to act in the opposite direction, if you identify the big players, you usually have to act in the same direction. But that too can often go in the pants. Because when a big player collects Ask in a sideways phase (accumulation phase), the course does not have to go immediately straight up. Often there is only a fake outbreak down, to turn off the possible Ask buyers. Only then does the course go up.
But the more good information you have, the sooner you can work out an advantage. Therefore, you have to create a good setup from the abundance of different indicators. And with this setup, only you can do something. Therefore, the indicator settings of me or other traders do not help you. Every trader interprets the market differently. That's why I recommend testing indicators and interpreting them yourself. It does not matter what another trader says or claims. If you look at your screen and recognize a particular pattern, that can often be worth more than any well-intentioned professional advice. For that you need training and a lot of screen time.
If an indicator does not help you, leave it. After I work with the stock market data, I know what I have missed the last few years. But that too is not a holy grail. The key is to create an individual setup from the flood of information that increases your chances of winning. And only you can do it alone. This blog is a wealth of information about possible setups, but not a specific system. Choose the best, test it extensively and create your own individual system. It takes time and is exhausting, but in my opinion it is the only chance we have.
I keep my fingers crossed for you and wish you the necessary endurance.
best regards
(You can download the described indicators at the end)
Hello dear traders,
The forex market differs from other financial markets at a very significant point: it consists of currency pairs. When you take a position, you trade two different currencies at the same time. This offers many interesting opportunities, as you can, for example, capitalize on your views on two economies with only one position. Therefore, it is difficult to look at the performance of a single currency in isolation.
Take as an example the EURUSD as a currency pair. If the price rises more in one day, there may be two reasons. The euro is particularly strong or the dollar particularly weak. It could well be that at the same time the euro is strong and the dollar is weak. There are different currency strength indicators with different calculation approaches.
Before I share my personal experiences, however, I would like to quote a few statements from Hanover. Hanover is a very experienced member of FF who enjoys a high level of acceptance and a very high reputation in this forum.
His statements about Currency Strength Meter:
But, assuming that there are no coding errors in the indicator calculations, accuracy is dependent solely on the price data being provided by the broker or market maker.
Which brings me to my next point(s). Firstly, all CSMs are derived from price, and price lags sentiment. In an industry where getting quickest access to quality information can provide a competitive advantage, institutional traders tend to use indicators that quantify sentiment, economic flows, orderflow/liquidity etc. (Many of these indicators are proprietary and lie beyond the scope of 'retail' charting packages like MT4).
Secondly, all price analysis is retrospective, and as price moves as waves within waves, this opens the door for arbitrariness that can only be resolved by selective bias. To explain with an example: the last 10 candles might represent an up-move, but these may be the most recent part of a larger sideways move, which in turn may be part of a larger down-move. Hence, like all other technical measures (e.g. moving averages, regression lines, etc), the price-derived CSM measure is determined arbitrarily by the historical horizon that's under study. There is no objective way of proving that one horizon is superior to another, that one way of calculating the value is superior to another, and hence that one CSM is necessarily superior in its 'accuracy' to another. All are ultimately giving a retrospective view of what price has done, and have no greater predictive value than price itself (or any other derivative of price).
Thirdly, predictive value comes down to the strength of the underlying sentiment which is determined by a number of fundamental reasons, many of which are economic, structural and/or logistical. If, for example, a CSM says that EUR is weak and USD strong, then the downtrend in EURUSD will continue only if there are overriding reasons -- i.e. reasons that underlie price -- causing it to do so. A price based CSM is not equipped to take these fundamental factors into account.
Fourthly, a CSM is merely a tool, and it is down to the trader, and how s/he interprets the strength/weakness measure, and uses it in the context of an overall trading system, that is an ultimate determinant in success or failure.
These statements from Hanover are important for now, before we take a closer look at individual currency strength indicators. Basically, I do not recommend spending money on a currency strength indicator. Within FF there are great traders and programmers who offer you different currency strength indicators for free.
More information is available at:
Recent Strength indicator
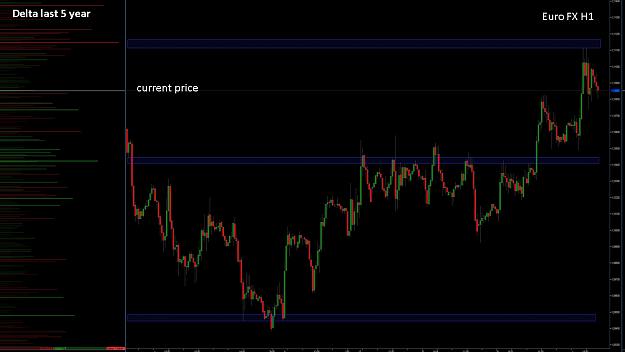
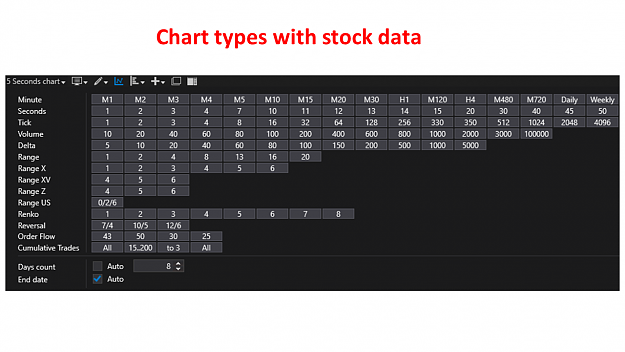
The different CSM indicators calculate the currency strength from the different currency pairs in the 9 available time units. Ticks are provided by the brokers, but not kept due to the high storage requirements. To calculate a currency strength in the tick chart, you would first have to generate all the currency pairs in the tick chart in order to derive a calculation from it. Thus a currency strength in the tick chart is not representable, because too expensive. In addition, a tickchart runs in the offline chart, which makes things even more complicated. Let us restrict ourselves to the 9 known time units in the MT4. I have tried different CSM indicators, which were also recommended by Hanover and use the following modules.
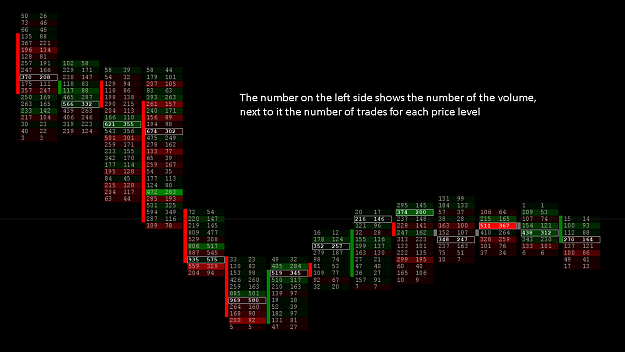
Attached Image (click to enlarge)
MADdash indicator, Developer: honestknave high impact member FF. A multi-timeframe dashboard calculated from the price. 8 currencies CHF, JPY, CAD, USD, EUR, GBP, AUD and NZD are compared. This gives rise to the strength of 28 currency pairs. Green means strength, red means weakness. Time frames are possible from M1 to MN. The indicator can be used individually. More information is available at:
MADdash (Moving Average Distance)
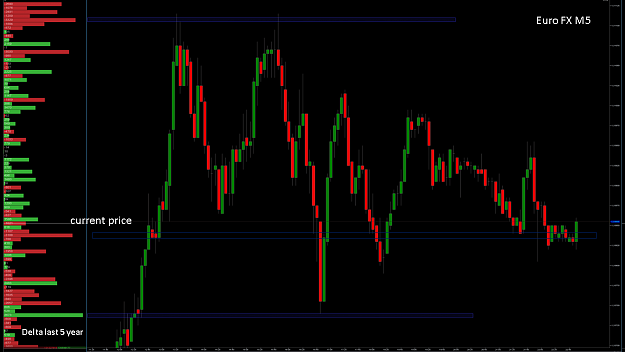
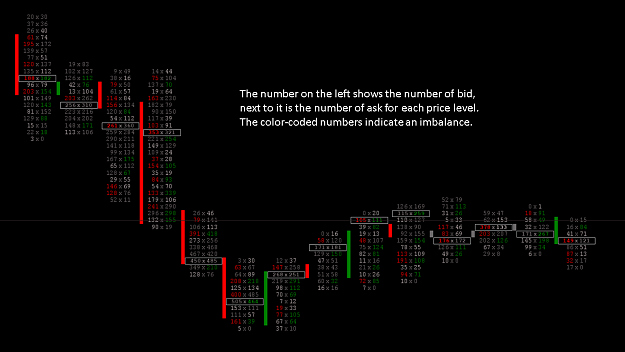
Attached Image (click to enlarge)
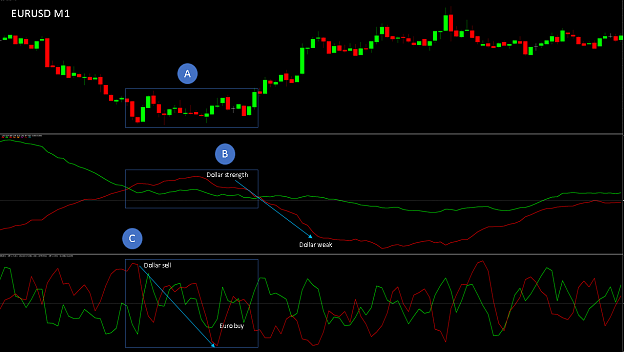
From the professional indicator of honestknave I have created an optimal representation for me. If the dollar is strong only a red color appears, if the euro is strong, a green color appears. With that I achieve a better overview for me.
Point A: In the upper red boxes, the strength of the dollar from M1 to MN is calculated against the following currencies: CHF, JPY, CAD, EUR, GBP, AUD and NZD. The last two candles are calculated.
Point B: In the red fields, the dollar moves from M1 to MN against the following currencies: CHF, JPY, CAD, EUR, GBP, AUD and NZD. Only the current candle is calculated. The lower field (Point E) is a summary of the 7 fields above. I have hidden this series in my current presentation.
Point C: In the green fields, the Euro changes from M1 to MN against the following currencies: CHF, JPY, CAD, USD, GBP, AUD and NZD. Only the current candle is calculated. The lower field (Point E) is a summary of the 7 fields above. I have hidden this series in my current presentation.
Point D: In the lower green boxes, the strength of the Euro is calculated from M1 to MN against the following currencies: CHF, JPY, CAD, USD, GBP, AUD and NZD. The last two candles are calculated. On the right is a bionic chart (64 tick) for the video overview.
Inserted Video
The price is in a downtrend for the first 2 minutes, the strength of the dollar is clear. After 2 minutes slowly arises a euro strength, whereby initially the dollar is strong. The strength of the euro is increasing and the price is rising.
However, this type of ad is very short-term and therefore very volatile. It shows me very fast price changes, which are not always reliable. Basically, I warn against start a trade based on these views. In an ongoing trade, this can be very helpful at times to avoid getting out too early.
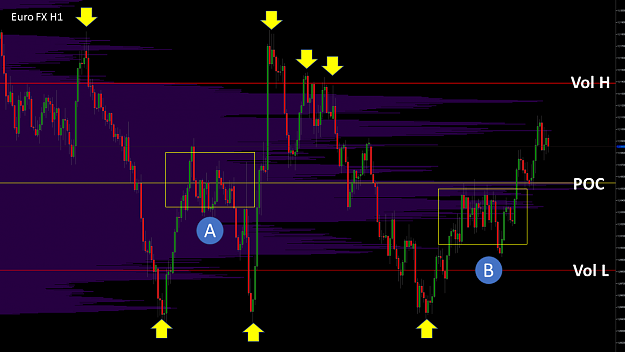
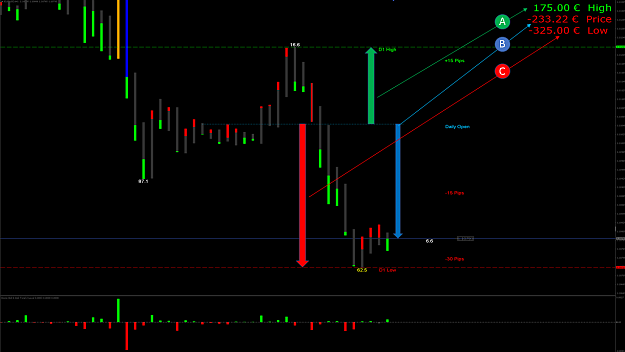
Attached Image (click to enlarge)
In addition, I also like to use the following indicators
CCFp Indicator, Developer: SemSemFX, Interesting currency strength meter
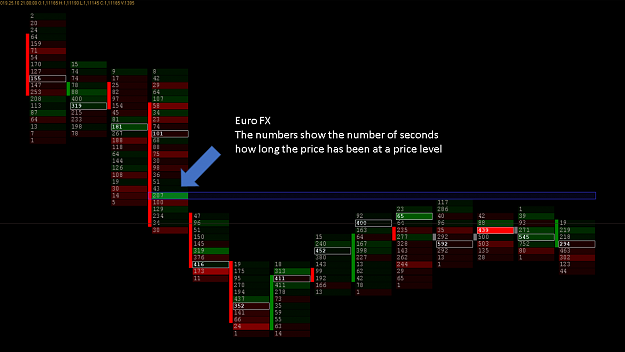
+ RS_Group EUR & USD indicator, Developer: unknown, Very interesting strength indicator that reacts faster than the price chart. Here, the euro was currently compared to the dollar.
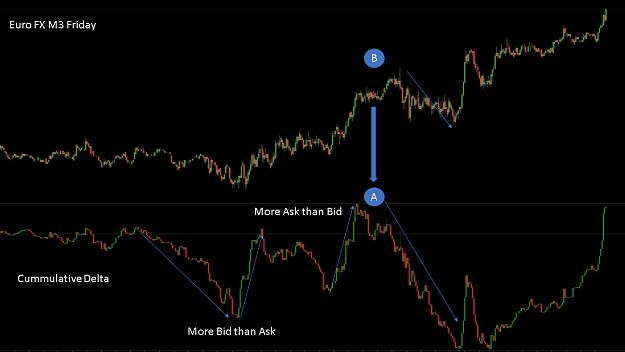
I recommend you to test these indicators during operation and to create your own interpretation. The big advantage of trading currency pairs is that there is a strength for the euro and the dollar, which often helps me identify what is happening in the market. However, this is no guarantee that this will remain so in the future. And for this we need the stock market data to detect possible absorptions in bid or ask. The Forex market is all about gaining an information advantage over most market participants.
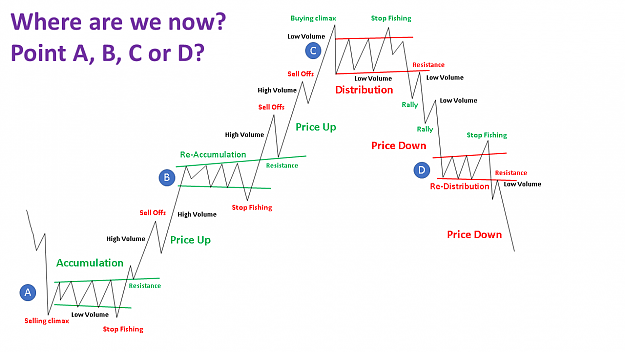
If you identify the retail traders you usually have to act in the opposite direction, if you identify the big players, you usually have to act in the same direction. But that too can often go in the pants. Because when a big player collects Ask in a sideways phase (accumulation phase), the course does not have to go immediately straight up. Often there is only a fake outbreak down, to turn off the possible Ask buyers. Only then does the course go up.
But the more good information you have, the sooner you can work out an advantage. Therefore, you have to create a good setup from the abundance of different indicators. And with this setup, only you can do something. Therefore, the indicator settings of me or other traders do not help you. Every trader interprets the market differently. That's why I recommend testing indicators and interpreting them yourself. It does not matter what another trader says or claims. If you look at your screen and recognize a particular pattern, that can often be worth more than any well-intentioned professional advice. For that you need training and a lot of screen time.
If an indicator does not help you, leave it. After I work with the stock market data, I know what I have missed the last few years. But that too is not a holy grail. The key is to create an individual setup from the flood of information that increases your chances of winning. And only you can do it alone. This blog is a wealth of information about possible setups, but not a specific system. Choose the best, test it extensively and create your own individual system. It takes time and is exhausting, but in my opinion it is the only chance we have.
I keep my fingers crossed for you and wish you the necessary endurance.
best regards
Attached File(s)
Forget:That does not work, amateurs build the ark, pros the Titanic!
5