I'm on my 2nd reading on The Secret Science of the Stock Market ( Jenkins )
The first cursory reading was super eye-opening. Planning to go 3 or 4 times as I practice, then read Squaring the Range.
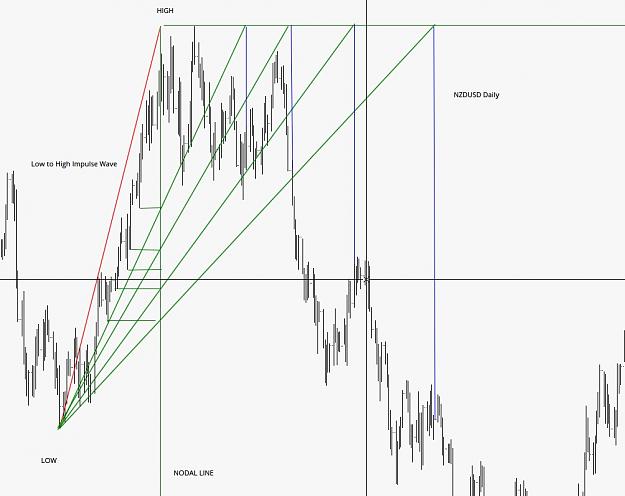
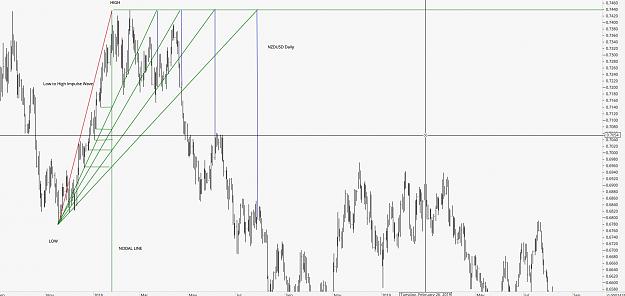
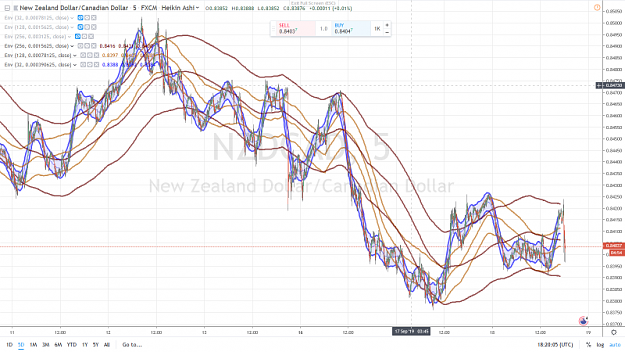
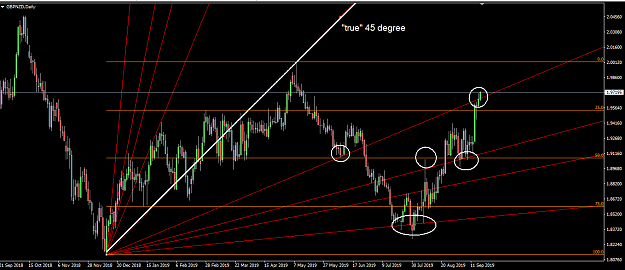
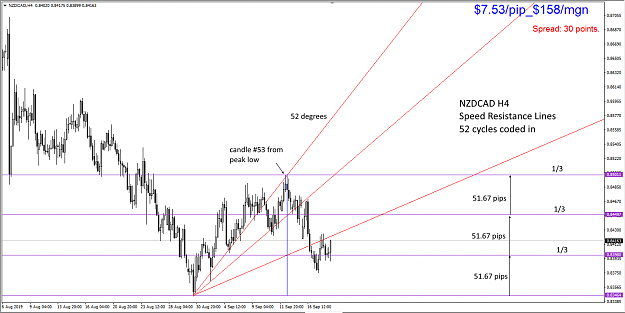
Tried out Speed Resistance Lines on NZDCAD H4 (seemed to lend itself to them, looks similar to the chart Jenkins used to illustrate)
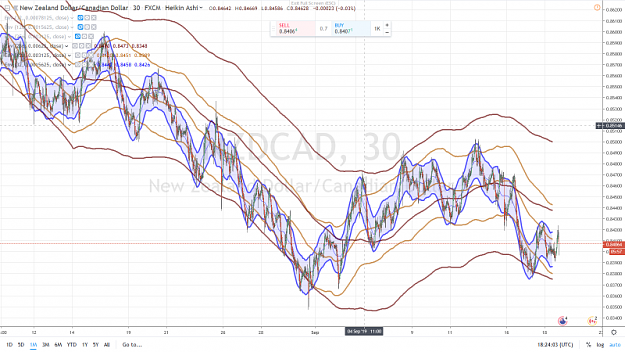
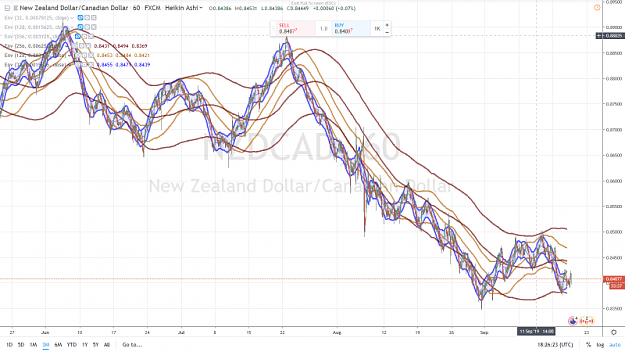
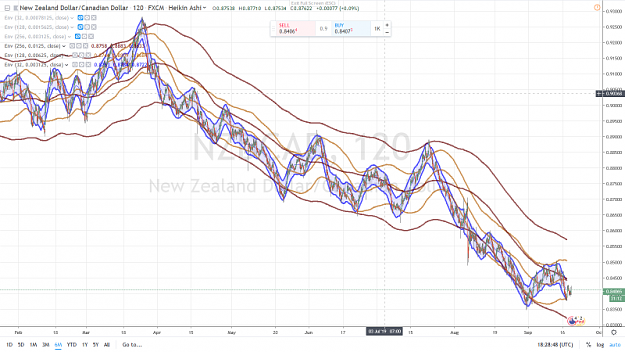
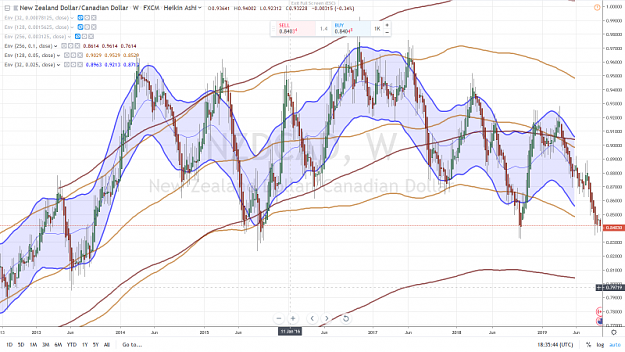
In the process, seems NZDCAD has 52 coded into its structure. Even switching to Weekly charts shows major highs/lows at 52 and 26 counts
I'll track it going forward like a hunter does his prey ( @CaptainJack )
Cheers
The first cursory reading was super eye-opening. Planning to go 3 or 4 times as I practice, then read Squaring the Range.
Tried out Speed Resistance Lines on NZDCAD H4 (seemed to lend itself to them, looks similar to the chart Jenkins used to illustrate)
In the process, seems NZDCAD has 52 coded into its structure. Even switching to Weekly charts shows major highs/lows at 52 and 26 counts
I'll track it going forward like a hunter does his prey ( @CaptainJack )
Cheers
Attached Image (click to enlarge)
3