This is for Chris ( and others interested )
Good morning Chris,
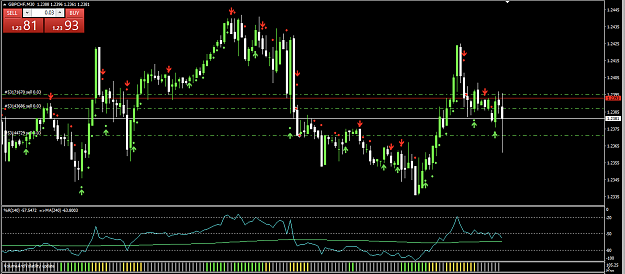
I am going to post 2 screenshots and possibly a third as well regarding Vol&Volatility interpretation for your kind perusal and comments:
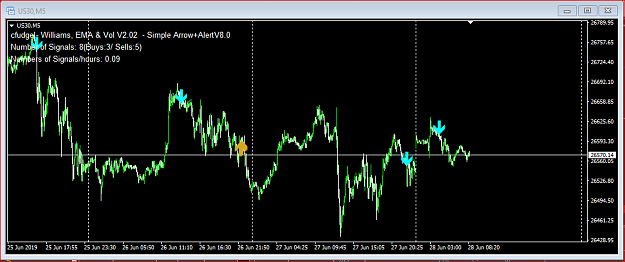
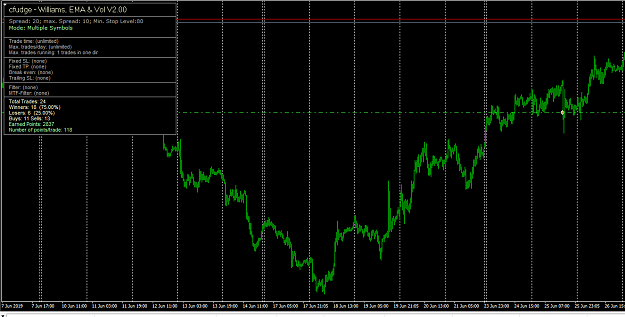
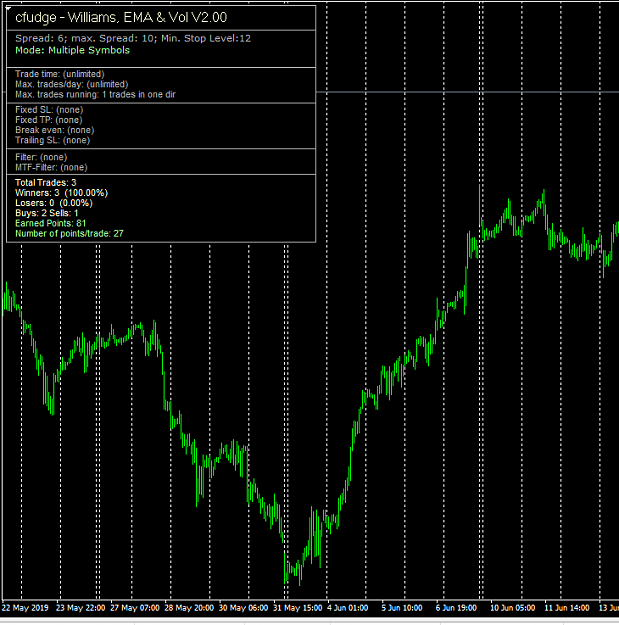
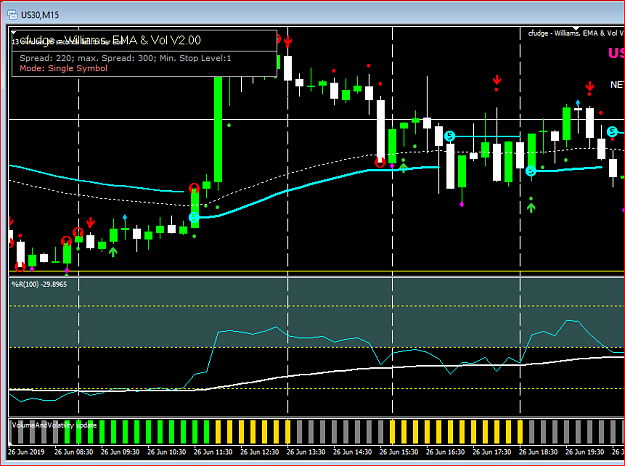
1. The Vol&Volatility started on the left and trade could have been taken one candle later - where the vertical line is placed as the WPR crossed the 55-ema by smallest of margins. It stays Green all the way and only switches to Yellow on the longest candle which could be seen as an exhaustion candle. It changes to Yellow and stays Yellow in spite of volume clearly diminishing until the Gray bars started forming.
Here is the interesting part, when the next bar prints, it is Yellow. How do you interpret this Yellow Bar? Is it for a LONG as it is still above the 55-ema on the Oscillator or is it perhaps showing volatility in general for further short as you can clearly see between those 2 vertical lines.
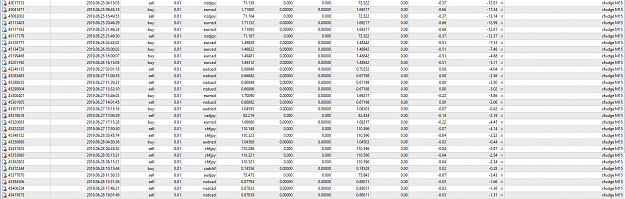
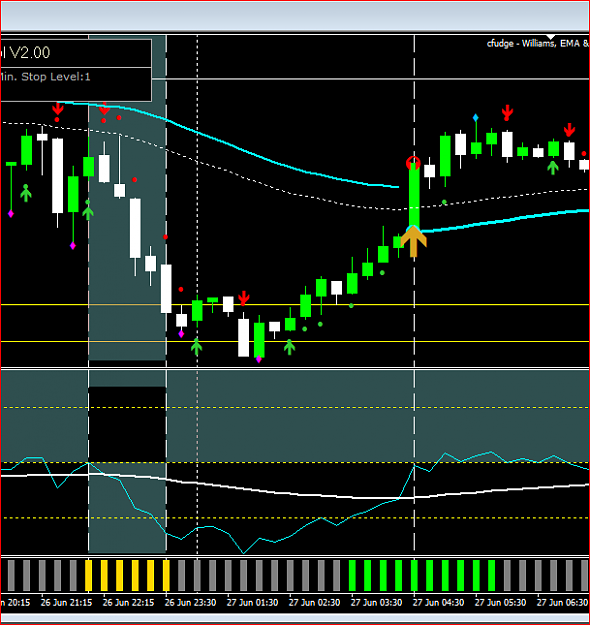
2. More interestingly, the second screenshot:
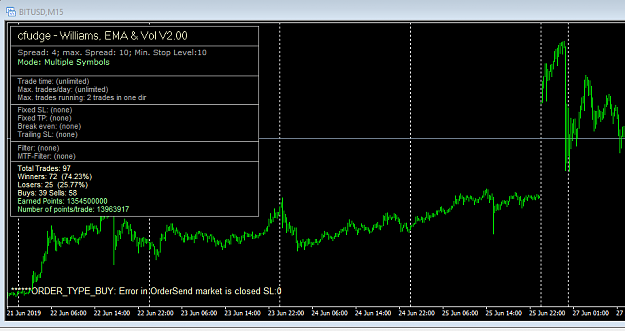
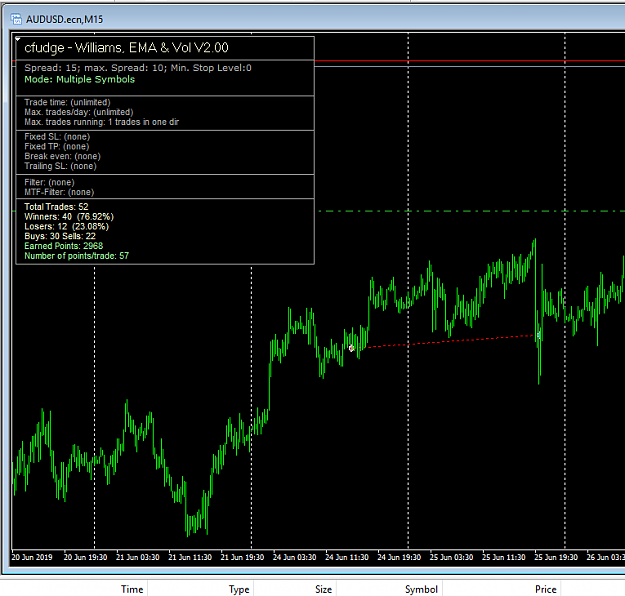
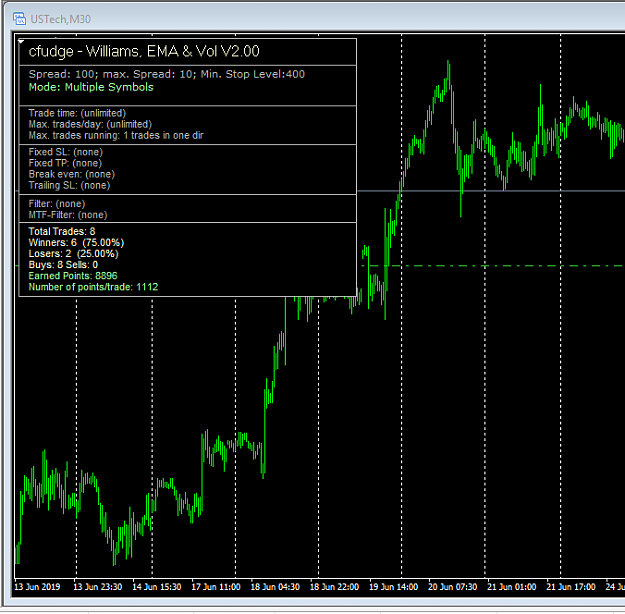
Here we also have Yellow Bars from Gray and the interpretation cannot be anything other than that the short is on.
Thank you for your time once again and also for "ignoring" my filter on the chart.
Successful day to you,
Hercs.
Good morning Chris,
I am going to post 2 screenshots and possibly a third as well regarding Vol&Volatility interpretation for your kind perusal and comments:
1. The Vol&Volatility started on the left and trade could have been taken one candle later - where the vertical line is placed as the WPR crossed the 55-ema by smallest of margins. It stays Green all the way and only switches to Yellow on the longest candle which could be seen as an exhaustion candle. It changes to Yellow and stays Yellow in spite of volume clearly diminishing until the Gray bars started forming.
Here is the interesting part, when the next bar prints, it is Yellow. How do you interpret this Yellow Bar? Is it for a LONG as it is still above the 55-ema on the Oscillator or is it perhaps showing volatility in general for further short as you can clearly see between those 2 vertical lines.
2. More interestingly, the second screenshot:
Here we also have Yellow Bars from Gray and the interpretation cannot be anything other than that the short is on.
Thank you for your time once again and also for "ignoring" my filter on the chart.
Successful day to you,
Hercs.
Attached Image(s) (click to enlarge)
Hercs