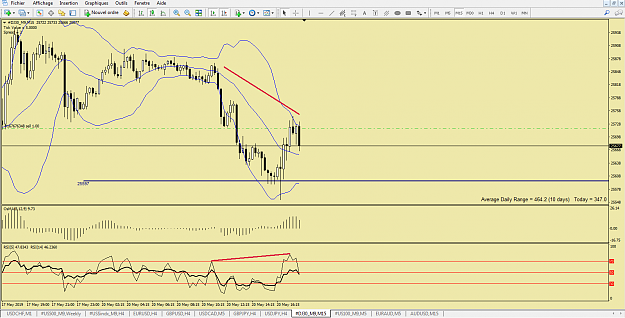
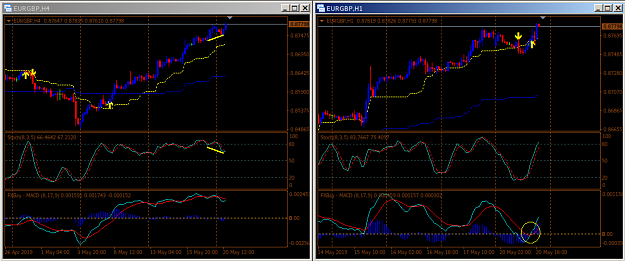
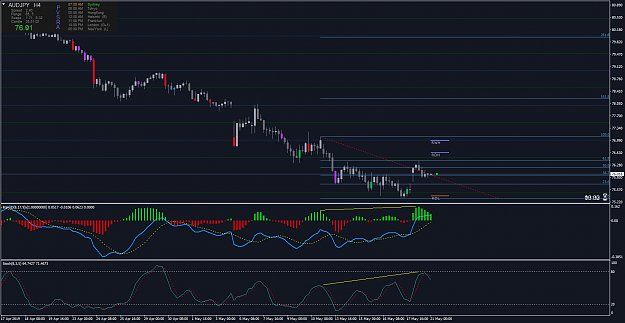
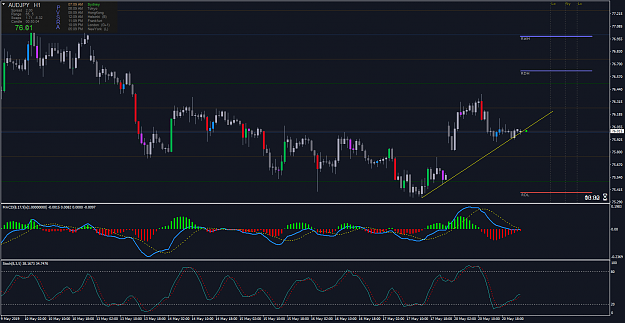
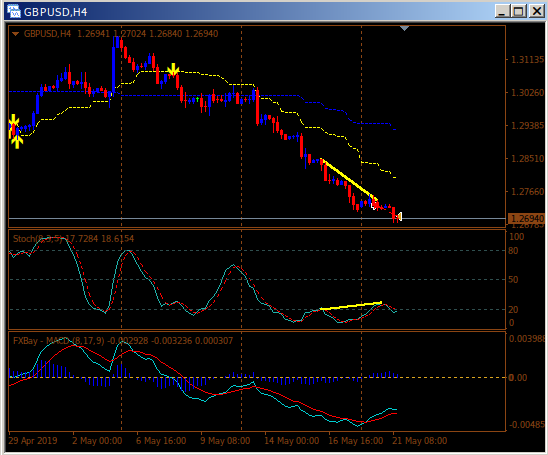
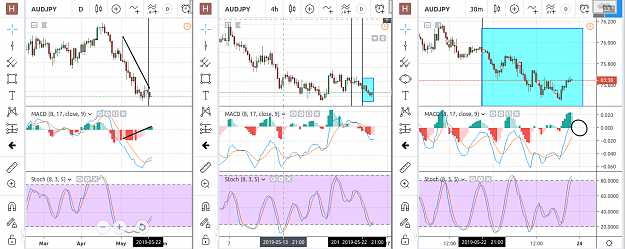
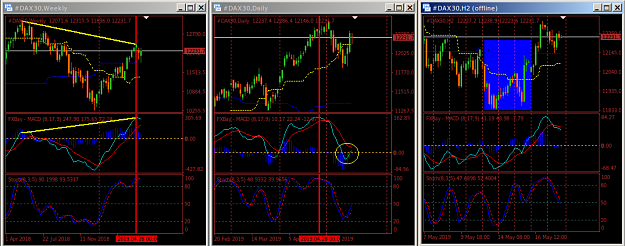
DislikedHere is an example of managing hidden divergence with a drill down approach which I think is ideal for high timeframes that have a high level of risk. The HD pattern is identified on the Monthly chart (yellow trend lines). Switching to the Weekly chart, we wait for a trading zone (blue rectangle) to start (red vertical line). An entry given by MACD crossing the zero line to the down side is possible at that point, but still, the risk might be too high. {image} Switching to the 4 HR chart, we wait for every signal that MACD is giving us crossing...Ignored
1