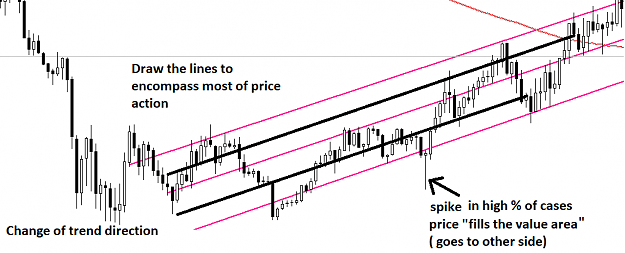
DislikedHello all, I've long been a follower of Laurentiu Damir's theories of the market and I want to share this chart which has a couple of views on GAPS and TARGET levels and I'm proposing that there is actually a DIAGONAL aspect at play..... Note the control (centre "fair-value" diagonal) runs through Gaps in price. Additionally I've marked a couple of Herd areas and the price moves away ran to the equidistant parallel diagonals which seem to be Target levels. I raised this area of study a couple of times on the other thread..... Dunno....seems like...Ignored
To date we've been using TOPS and BOTTOMS to detect target levels used by the MM to lure traders into buying, selling, moving stops. And the way the TOPS and BOTTOMS have been drawn both manually (by @George) and the MMDetective and @SwingMan's indicators is using horizontal lines. But if the MM's goal is to lure traders, then they don't necessarily have to be horizontal lines -- they could be diagonal lines, as well. That is, anything that lures traders to do what the MM wants. I still think the ultimate goal is to increase liquidity so unfilled orders can be transacted -- but exactly how that is accomplished probably doesn't matter to the MM.