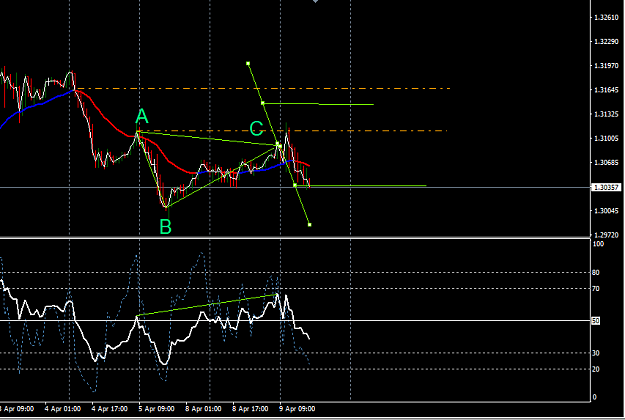
DislikedOK … When the session begins I tend to watch the 5 min intently for the signals produced there. For this I need to show the two RSI indicators. The first was a bull RSI div (D1) but the run up ran into a bear div so we either close or hedge depending on your circumstance. The run down went to another RSI div (D2) so it was now set up to pass the latest swing high average which it did convincingly with an impulse bar taking it to and above the target level. This then pulled back because it was a reg bear div. but the bulls found support (dotted green)....Ignored
What HD stands for ? Hidden divergence ? I don't see it where on your wrote HD on your chart.