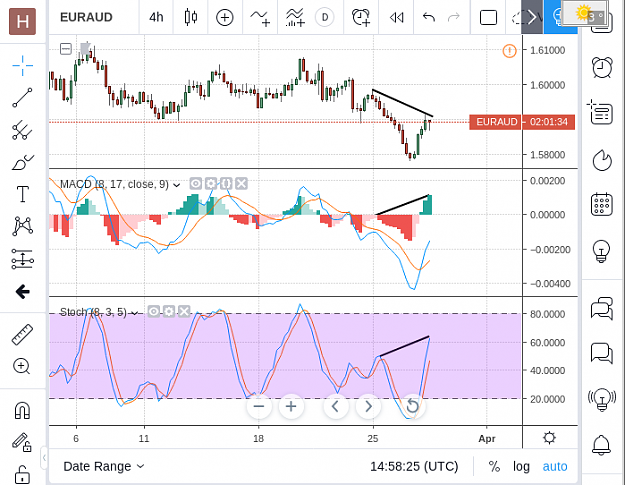
Here is a potential HD setup on the 4HR chart, if price turns around. We are at a major Fib level. There is a regular divergence pattern on the 1HR chart, but price will have to cross the dotted trendline and MACD will have to cross its zero line down, those are the criteria I personally use. We have to be patient, but this an example of the way I monitor charts.
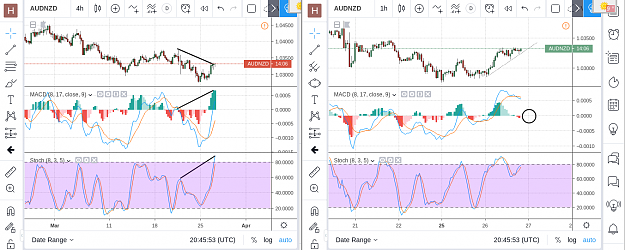
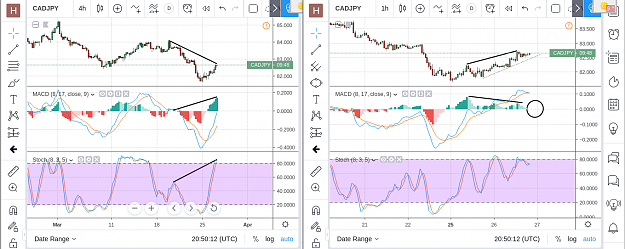
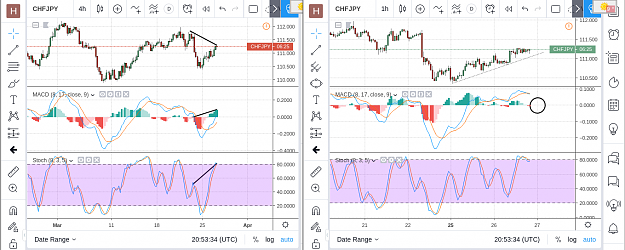
There are a few other HD pattern forming on the 4HR charts. But it doesn't mean that price will cooperate on any of these. We have to wait for all criteria to be met.
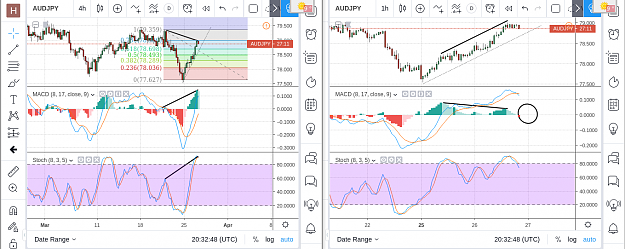
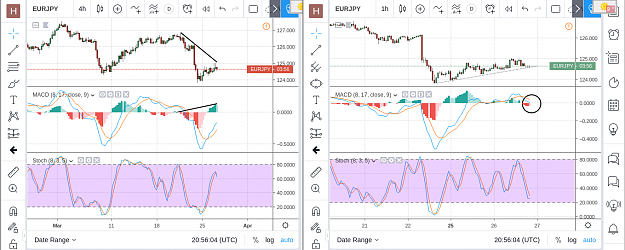
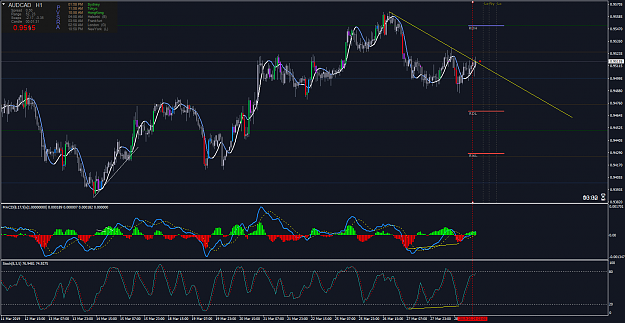
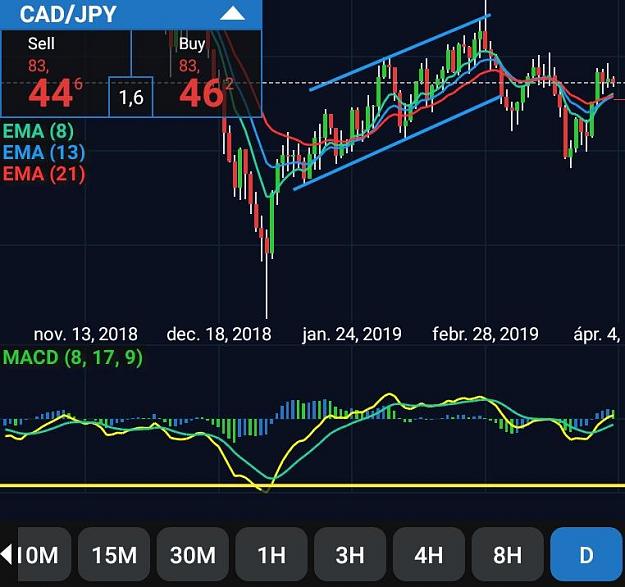
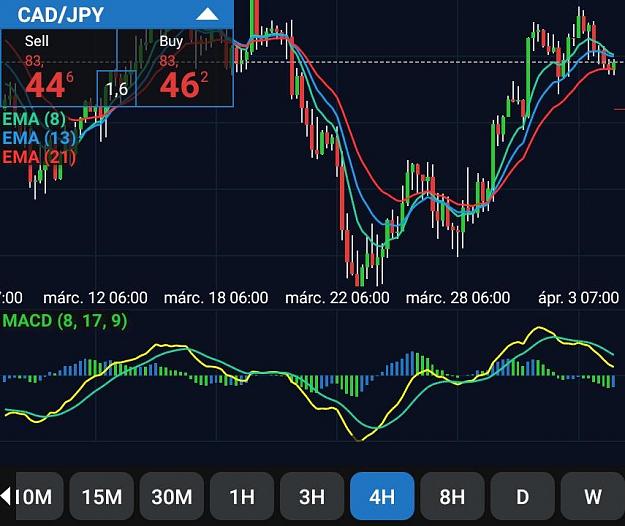
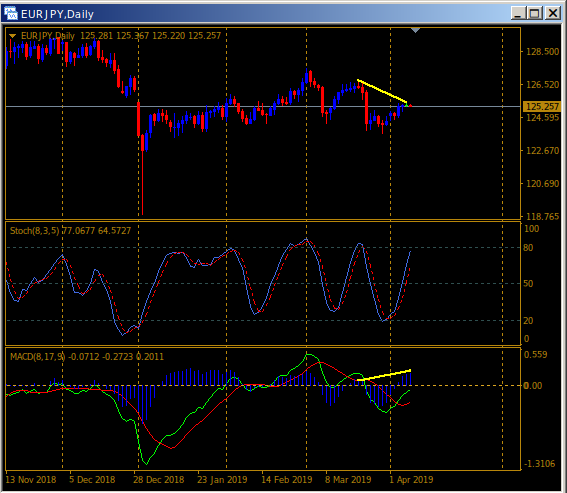
Here is a potential HD setup on the 4HR chart, if price turns around. We are at a major Fib level. There is a regular divergence pattern on the 1HR chart, but price will have to cross the dotted trendline and MACD will have to cross its zero line down, those are the criteria I personally use. We have to be patient, but this an example of the way I monitor charts. {image}
Ignored
A nice HD pattern in the 4HR chart resulting in a good entry (vertical line) on the 1HR.
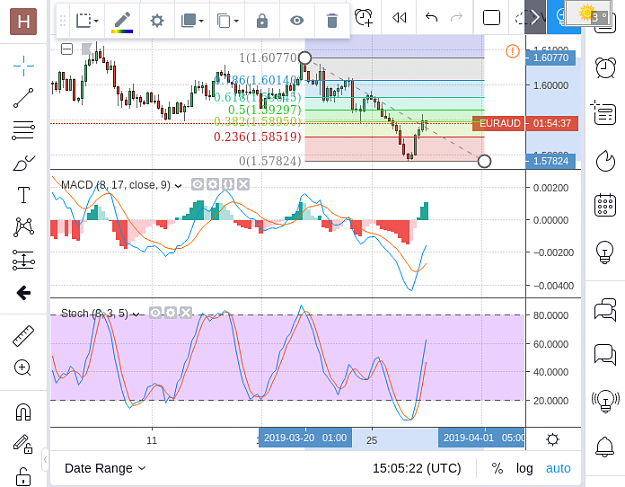
Another opportunity coming up. Price is at a resistance and good Fib levels so I think that there is a chance it will turn towards the down side. Let's wait and see.
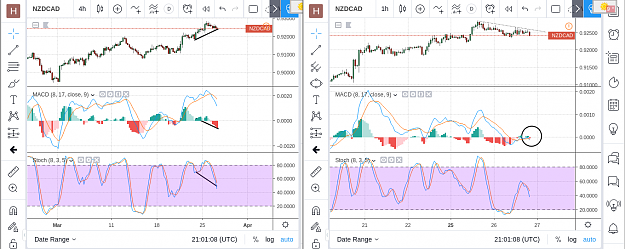
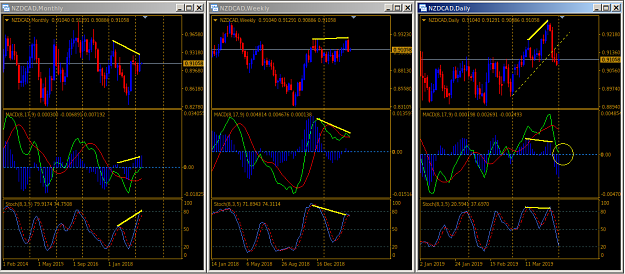
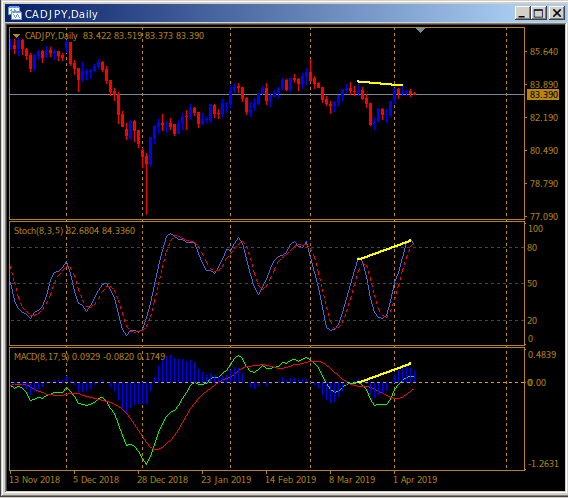
A triple divergence with NZDCAD. A hidden divergence on the monthly chart and a regular divergence on both the weekly and Daily charts. We could trade the Weekly, but I will jump on the Daily if MACD crosses the 0 line.
Here is food for thoughts on managing a trade in a hidden divergence situation:
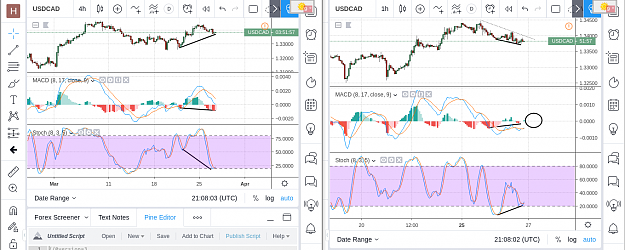
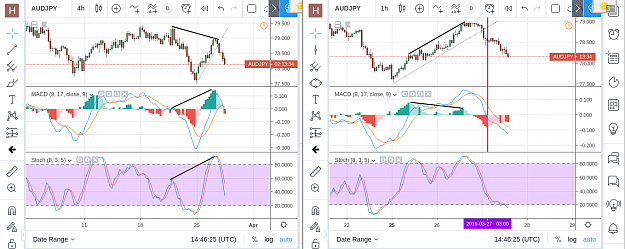
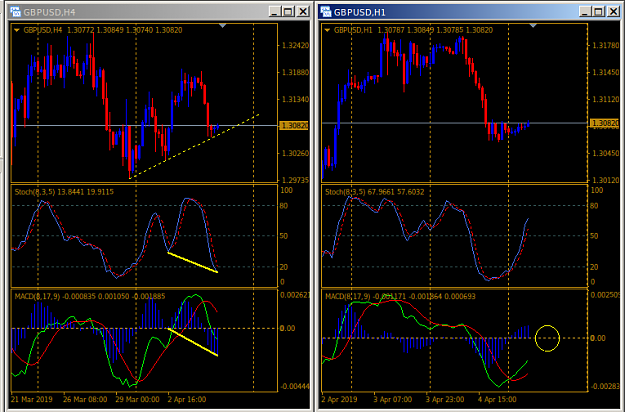
we identify a HD pattern. On the 4 HR chart, the oscillators were making lower lows crossing the horizontal dotted line, but price was going the other way. This is the sign of a hidden divergence (bold yellow lines). That is when I go to a shorter timeframe to look for entry signals.
entry signals on the lower TF. From a 4HR chart, I usually go to the 1 HR TF. We can wait for a cross of a trendline like the dotted one to enter. This is what I call an aggressive method. We can see that such an entry would have given a winner with a RR=1:1 or RR=1:2. I prefer to wait for the MACD line to cros its 0 line to enter (circle or first vertical line). In that case, it would have been a losing trade because price reversed shortly after (second vertical line). Instead of waiting for price to reach our stop loss (red vertical dotted line), I get out as soon as the MACD crosses the 0 line again (second vertical line). In our case, it would have given a small loss. Recently, I have been using the "cost averaging" method suggested by Gerald E. Greene in his book "Turning losing Forex trades into winners"" According to this method, when we get an entry signal on a timeframe, we go to the timeframe 8 to 12 times lower and take all the signals that are occurring in what I call the trading zone (blue square.)
cost averaging. The appropriate timeframe for trading would be the 5 minutes (12 times lower). As we can see, MACD never crossed the 0 line upwards in the trading zone, so there were no entries. More often than not, when you sum up all the trades in the trading zone, it should give you a winning situation. The author doesn't explain risk and profit levels, but I use a RR=1:1 for all trades in the trading zone, risking no more than 2% each time.
I will be using that method more often and will post results. It is very promising. However, when the trading timeframe is too short like the 5 minutes, it keeps you in front of the screen. You don't want to miss the winning trade that will make the difference on a cost average basis.
Here is food for thoughts on managing a trade in a hidden divergence situation: we identify a HD pattern. On the 4 HR chart, the oscillators were making lower lows crossing the horizontal dotted line, but price was going the other way. This is the sign of a hidden divergence (bold yellow lines). That is when I go to a shorter timeframe to look for entry signals. entry signals on the lower TF. From a 4HR chart, I usually go to the 1 HR TF. We can wait for a cross of a trendline like the dotted one to enter. This is what I call an aggressive method....
Ignored
Great explainaition, thanks alot!
Could you maybe show us a trade that directly went in profit, on the H4 timeframe, hit your TP (where do you take profit btw? 1:1 on the higher TF?), and also profitable scale in trades? Would be great! (Like just a 100% winner setup)
Im backviewing it now on the charts. It looks very promising, sometimes you can make +6 wins on the lowest scale in timeframe. But one question: if you can make +6 wins on the lower timeframe, in this case the 5 minute TF, why would we enter in the first place on the medium timeframe (1H), cause that just will be 1 winner in multiple hours.
Isnt it better to skip that medium timeframe entry, and just solely trade the lowest scale in positions? It would take less time to make more winst then.
Here is food for thoughts on managing a trade in a hidden divergence situation: we identify a HD pattern. On the 4 HR chart, the oscillators were making lower lows crossing the horizontal dotted line, but price was going the other way. This is the sign of a hidden divergence (bold yellow lines). That is when I go to a shorter timeframe to look for entry signals. entry signals on the lower TF. From a 4HR chart, I usually go to the 1 HR TF. We can wait for a cross of a trendline like the dotted one to enter. This is what I call an aggressive method....
Ignored
TOP SHELF Thks
If i get all these signs i usually just take a possie.. AND put a limit on what i am prepared to risk
Sorry for the spam haha. Im backviewing it now on the charts. It looks very promising, sometimes you can make +6 wins on the lowest scale in timeframe. But one question: if you can make +6 wins on the lower timeframe, in this case the 5 minute TF, why would we enter in the first place on the medium timeframe (1H), cause that just will be 1 winner in multiple hours. Isnt it better to skip that medium timeframe entry, and just solely trade the lowest scale in positions? It would take less time to make more winst then.
Ignored
Hi Jube,
Here is an example of a recent price move to illustrate my point:
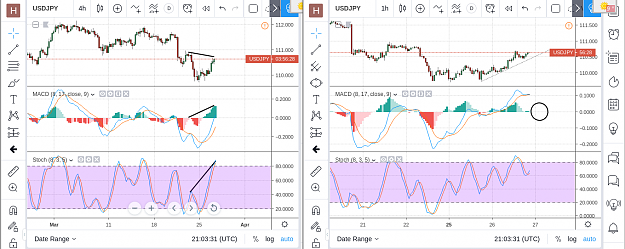
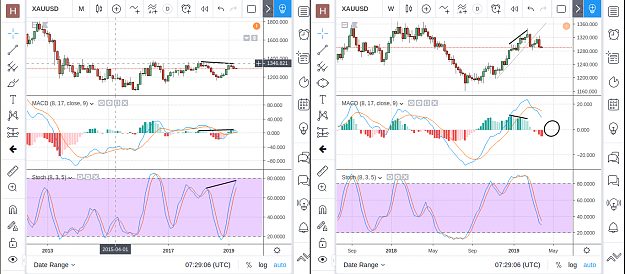
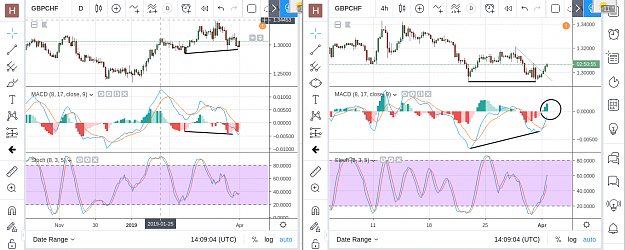
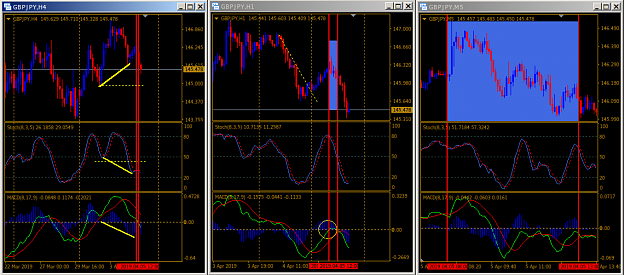
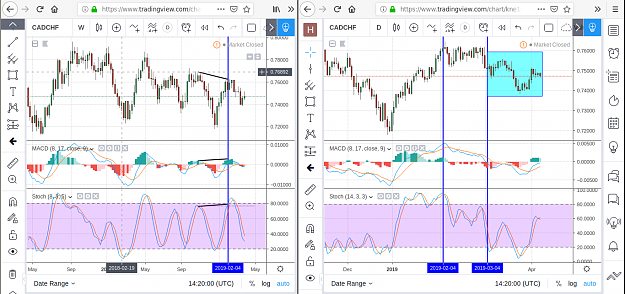
The first chart on the left shows that the indicators are getting higher levels than their last swing highs, but price is still lower than the last swing high. That is when I mark the pair as a potential hidden divergence pattern for that timeframe (Weekly for instance). Then I would switch to the next lower timeframe to confirm the pattern.
On the Daily chart, I would wait for the MACD to cross the 0 level. For me, this is the confirmation that the HD pattern on the Weekly chart is a valid one. You can use trendlines or other indicators, but I personally find that the MACD gives sound results. You can trade the MACD cross as an entry as I usually do, but I find it interesting to be able to confirm my chances of winning. For me, it is an additional tool to use. After the MACD zero line cross (second vertical line on the chart on the right), we enter what I call the trading zone (turquoise square) that extends until MACD crosses the zero line again.
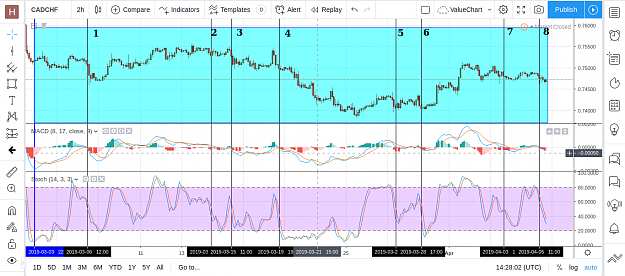
To trade in the zone, we go to a timeframe 8 to 12 times lower (according to Greene's book). In our case, it would be a 2 HR chart (bottom chart). Not all trading platforms provide that timeframe, but I use it for demo purposes. In the trading zone, we enter each time the MACD crosses the zero line. I marked all entry signals with a thin vertical lines. We can see that with a RR = 1:1, there were 6 winning signals and two losers (#5 and #6). I would trade all signal with a 2% risk.
Attached Image (click to enlarge)
Attached Image (click to enlarge)
This is just a suggestion. You can still trade with the MACD signal (or the signal you prefer) on the intermediate chart, but, as I said, knowing that you can confirm the odds of winning appeals greatly to me.
{quote} Hi Jube, Here is an example of a recent price move to illustrate my point: The first chart on the left shows that the indicators are getting higher levels than their last swing highs, but price is still lower than the last swing high. That is when I mark the pair as a potential hidden divergence pattern for that timeframe (Weekly for instance). Then I would switch to the next lower timeframe to confirm the pattern. On the Daily chart, I would wait for the MACD to cross the 0 level. For me, this is the confirmation that the HD pattern on...
Ignored
Hey Chamane,
Crystal clear now, thanks I'll check the charts this week for setups like this,