Hey everyone!!
Eventhough i already have a "main strategy" that i've been trading for some good time and that is explained in here>
https://www.forexfactory.com/showthread.php?t=859423
Im ALWAYS looking to take my trading skills to a new level WITHOUT changing what ive been doing but adding up to what i already do!
This is challeging because i hate to see an overload of indicators in my charts, and adding up to things that ive been doing, for me, does not mean adding more indicators, but working around to learn to trade things that i dont trade, for instance I DON'T TRADE REVERSALS, you can see in my thread that i don't, YET!
I used Bollinger Bands when i first started trading, and it wasen't "my thing" but since every weekend i go over the charts and prepare for the week ahead, i also play around searching for things that i didnt see before.
I came around with the following pictures:
Crazy right?
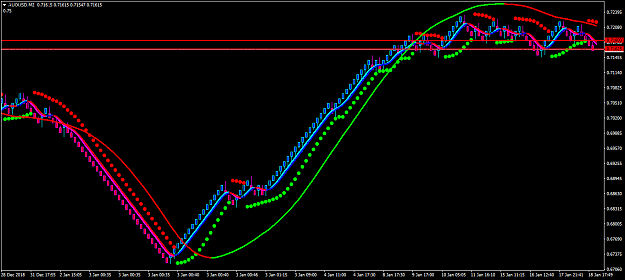
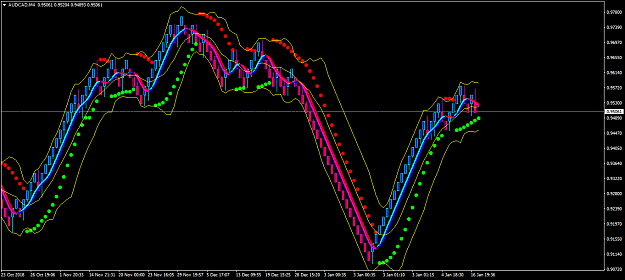
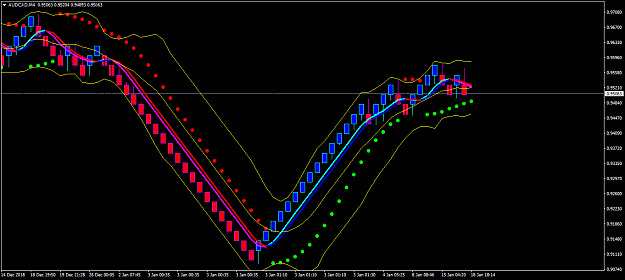
Well if you read my thread https://www.forexfactory.com/showthread.php?t=859423 , you'll see that i use 100 EMAS to the close, high and lows.
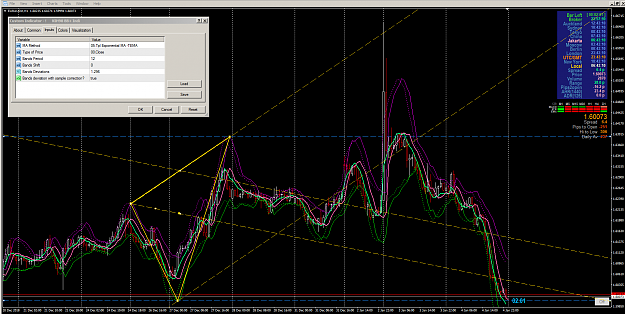
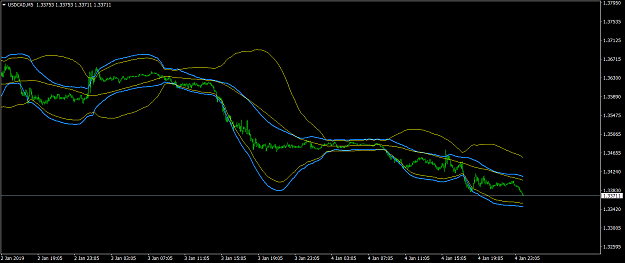
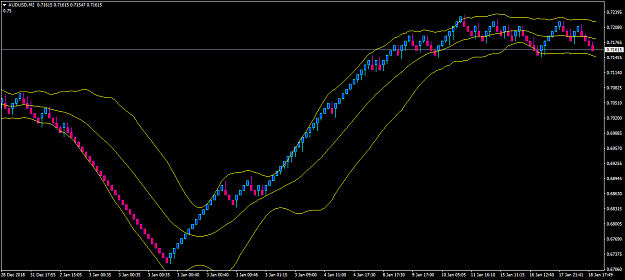
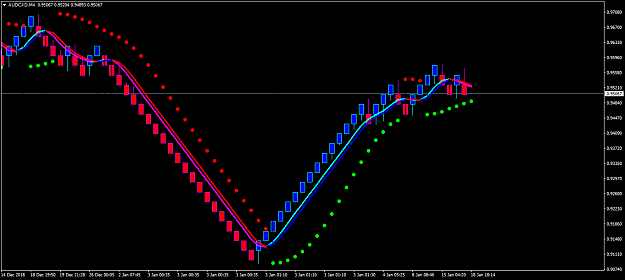
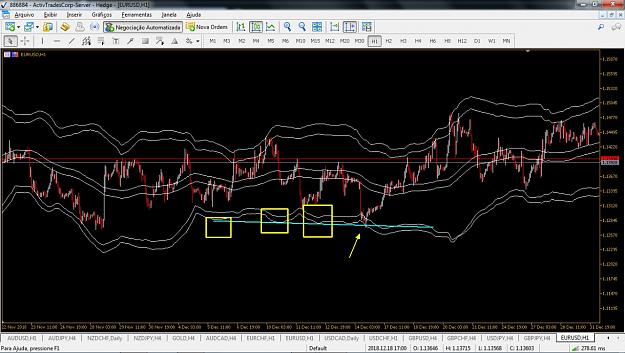
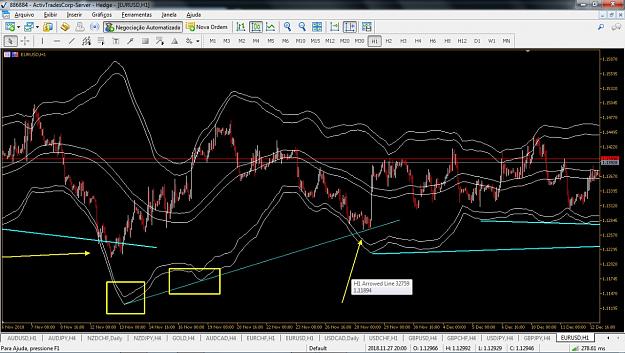
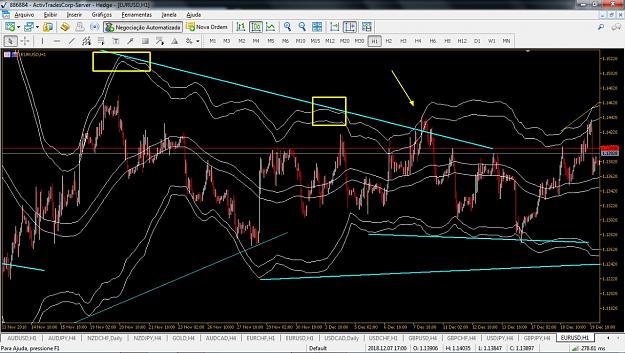
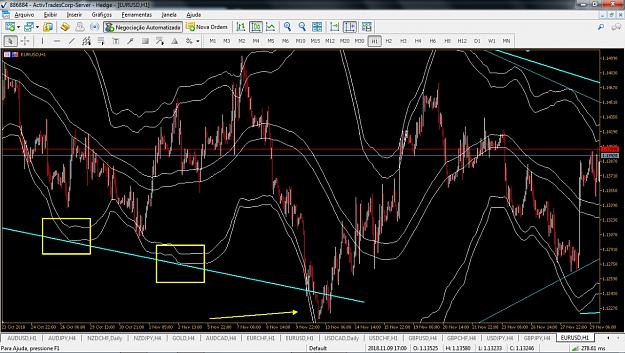
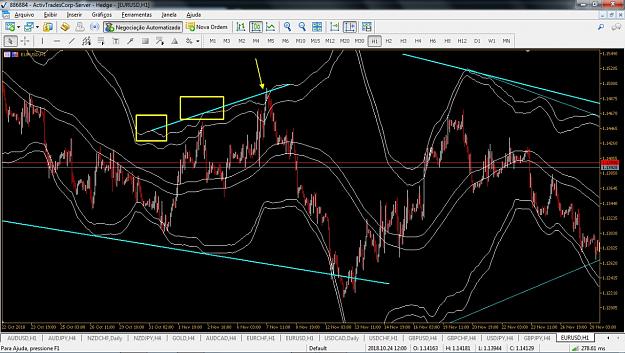
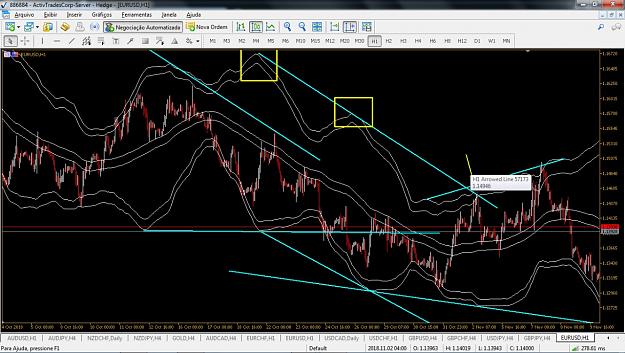
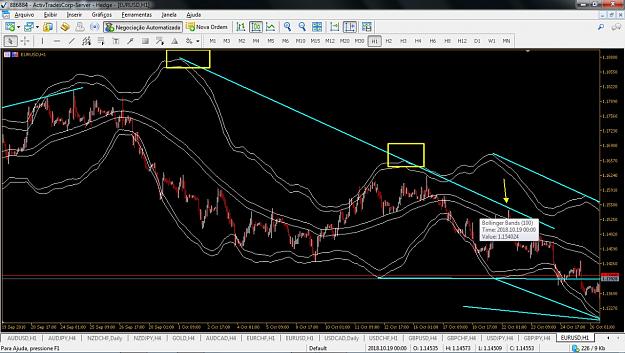
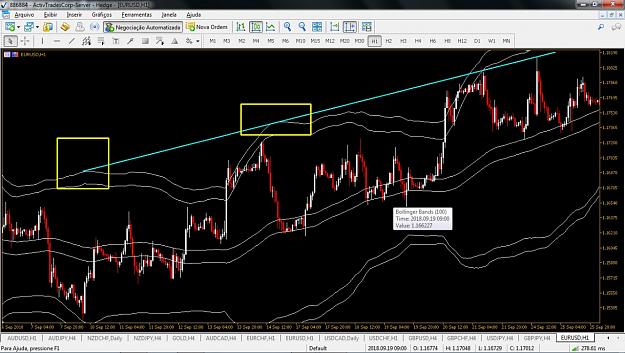
So since i dont want to change what i already do and im proftable with i added the BBolinger 100 period but with deviation of 2.618 (fib number just because lol) of the high and low. Obs: i took off the 100BB close coz i founf the chart too much polluted.
I'M HERE NOT TO MAKE ANY CLAIMS ABOUT THIS IMAGENS, I JUST WANT THIS THREAD TO BE A COLLABORATION ABOUT MY ASSUMPTIONS.
So let's talk !!!!
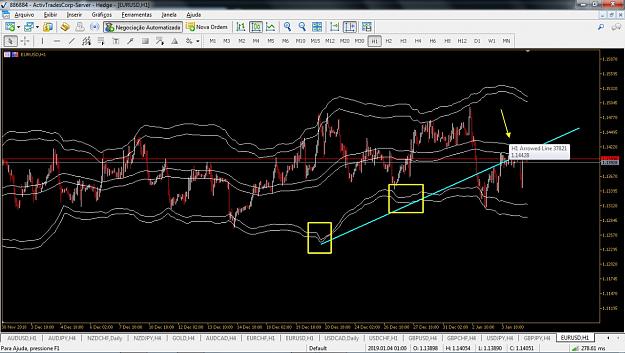
I basicly took the higher point at the bollinger band and connected them with trendlines, to get this turning point. Just have a look.
Obs: i might come around to make a Exponencial Bollinger band, i have no intentions to change my moving average settings. Cheers.
Eventhough i already have a "main strategy" that i've been trading for some good time and that is explained in here>
https://www.forexfactory.com/showthread.php?t=859423
Im ALWAYS looking to take my trading skills to a new level WITHOUT changing what ive been doing but adding up to what i already do!
This is challeging because i hate to see an overload of indicators in my charts, and adding up to things that ive been doing, for me, does not mean adding more indicators, but working around to learn to trade things that i dont trade, for instance I DON'T TRADE REVERSALS, you can see in my thread that i don't, YET!
I used Bollinger Bands when i first started trading, and it wasen't "my thing" but since every weekend i go over the charts and prepare for the week ahead, i also play around searching for things that i didnt see before.
I came around with the following pictures:
Attached Image (click to enlarge)
Attached Image (click to enlarge)
Attached Image (click to enlarge)
Attached Image (click to enlarge)
Attached Image (click to enlarge)
Attached Image (click to enlarge)
Attached Image (click to enlarge)
Attached Image (click to enlarge)
Attached Image (click to enlarge)
Attached Image (click to enlarge)
Crazy right?
Well if you read my thread https://www.forexfactory.com/showthread.php?t=859423 , you'll see that i use 100 EMAS to the close, high and lows.
So since i dont want to change what i already do and im proftable with i added the BBolinger 100 period but with deviation of 2.618 (fib number just because lol) of the high and low. Obs: i took off the 100BB close coz i founf the chart too much polluted.
I'M HERE NOT TO MAKE ANY CLAIMS ABOUT THIS IMAGENS, I JUST WANT THIS THREAD TO BE A COLLABORATION ABOUT MY ASSUMPTIONS.
So let's talk !!!!
I basicly took the higher point at the bollinger band and connected them with trendlines, to get this turning point. Just have a look.
Obs: i might come around to make a Exponencial Bollinger band, i have no intentions to change my moving average settings. Cheers.