[quote=DonSergion;11783821]Hello dear traders, Hello bionics. Many thanks to the author for the work done.
Hello DonSergion,
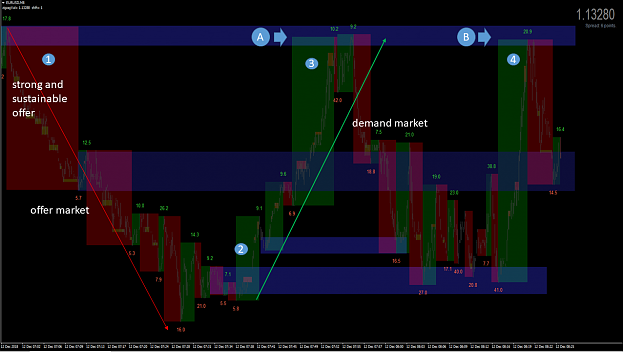
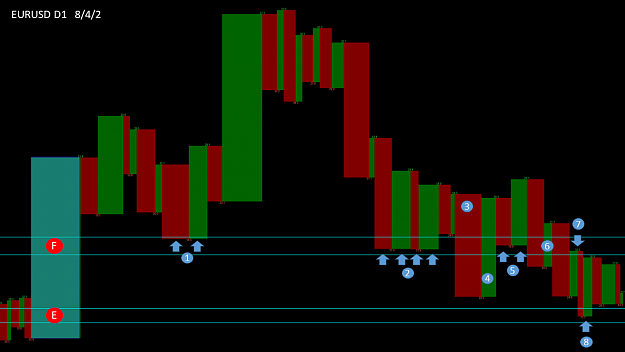
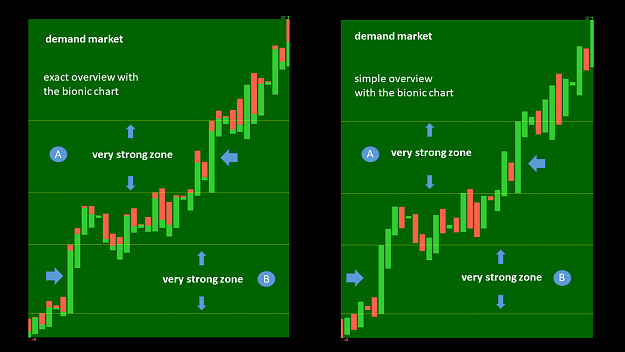
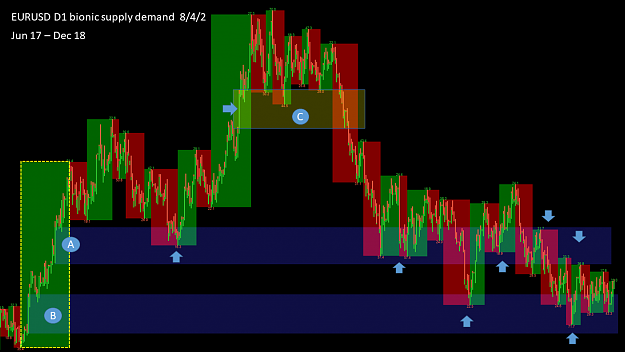
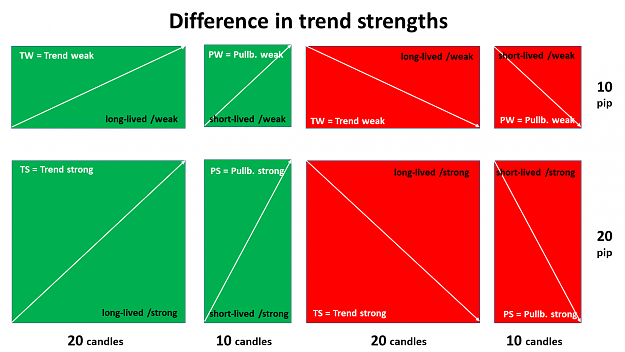
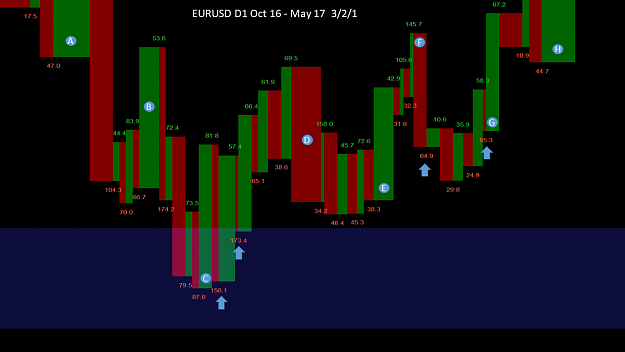
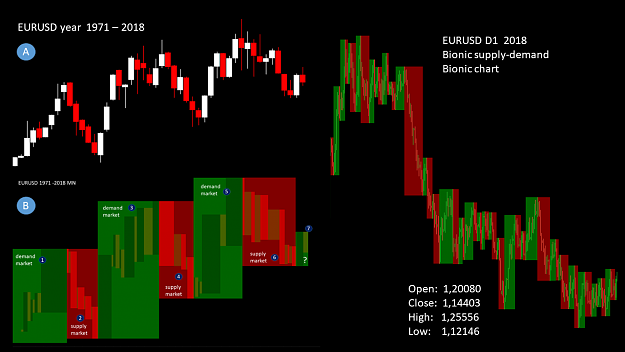
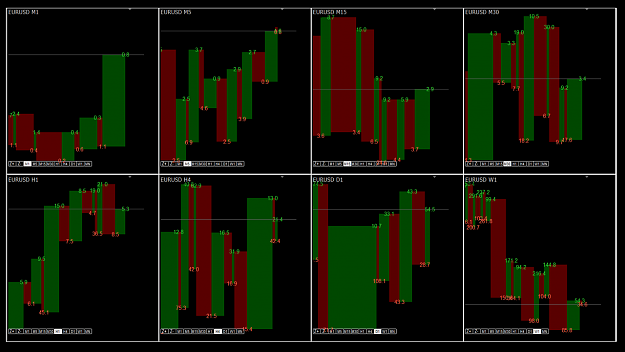
Thank you, I am convinced that our work has been worthwhile. We now have a framework that allows us to visualize supply and demand in the chart, which we can now build on. Here is a little example:
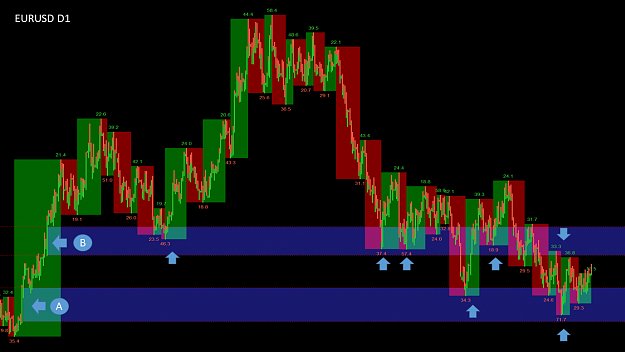
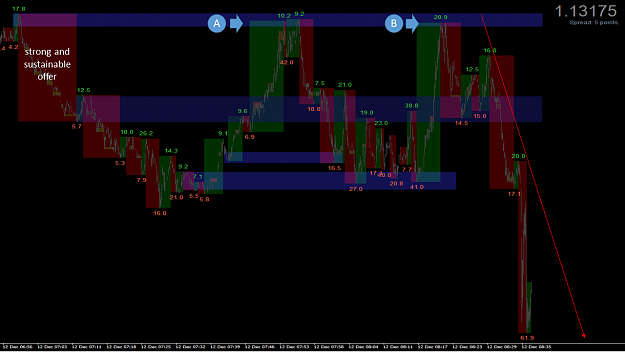
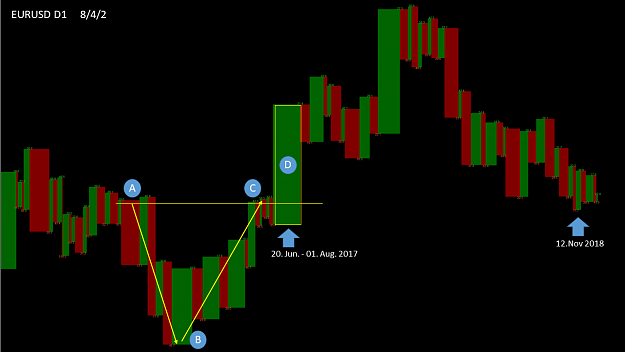
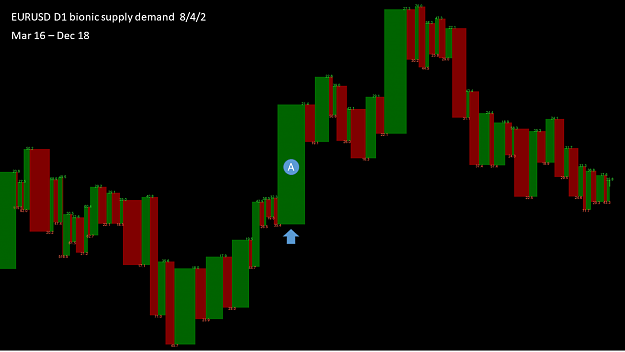
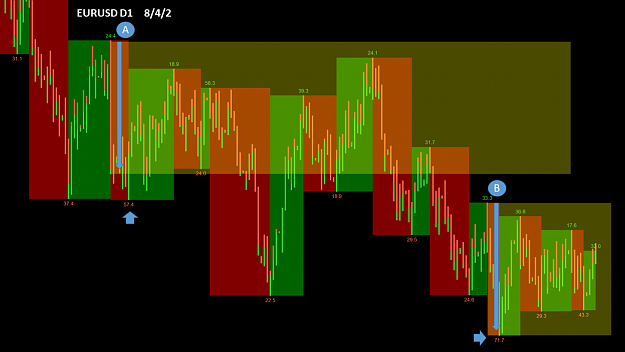
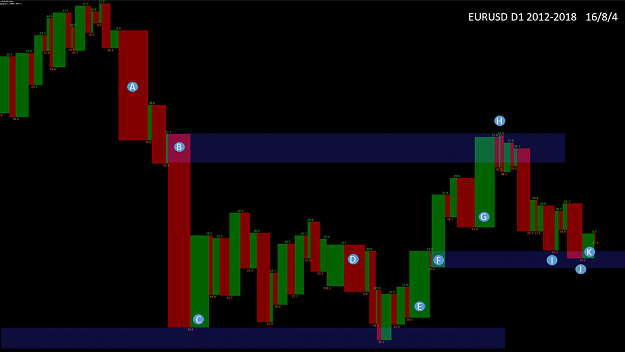
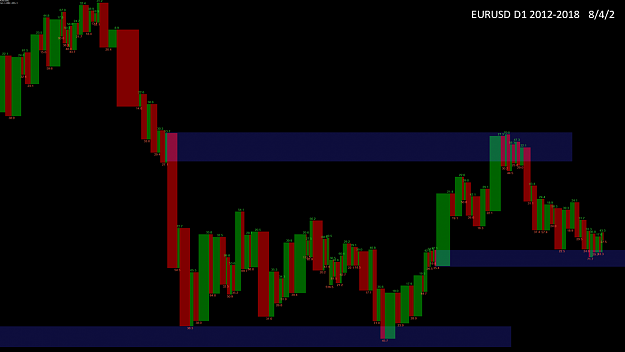
From June 2017 to August 2017, we had a very strong demand market in the D1 chart. Within this very strong demand market, there were two very strong candle movements at points A and B. This resulted in two zones. You can see how well the price has reacted to this zone.
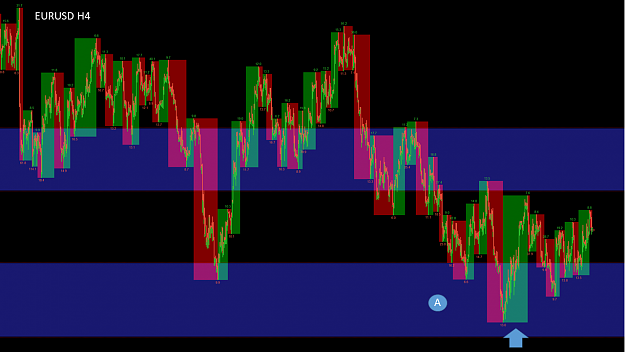
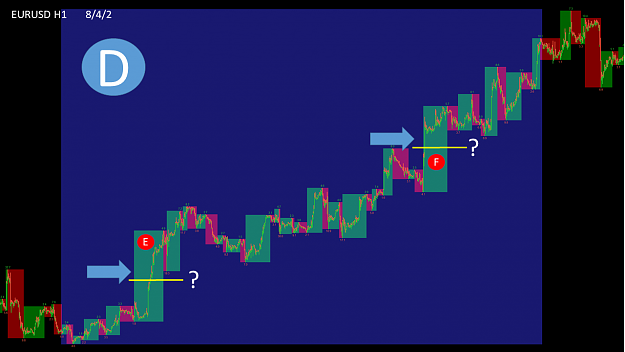
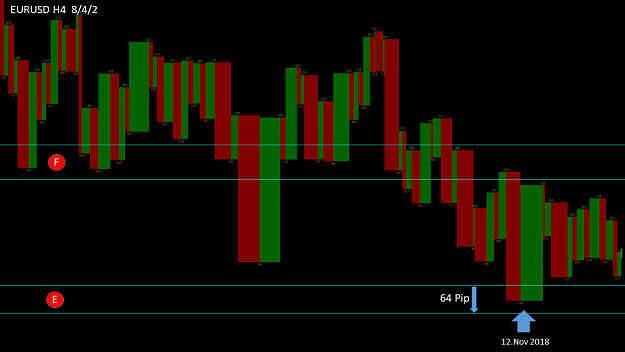
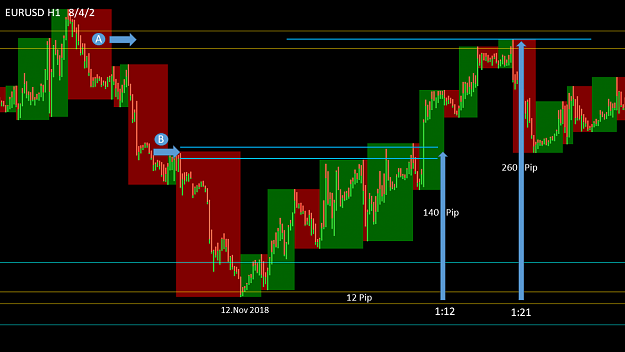
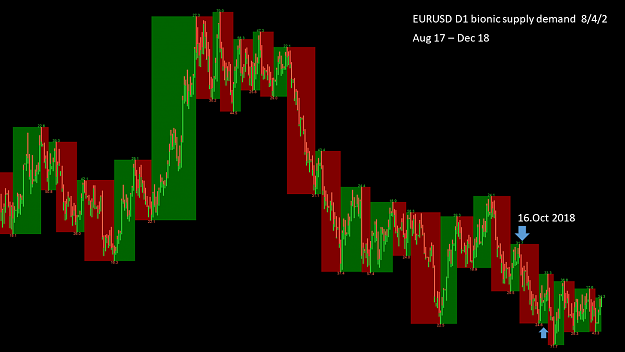
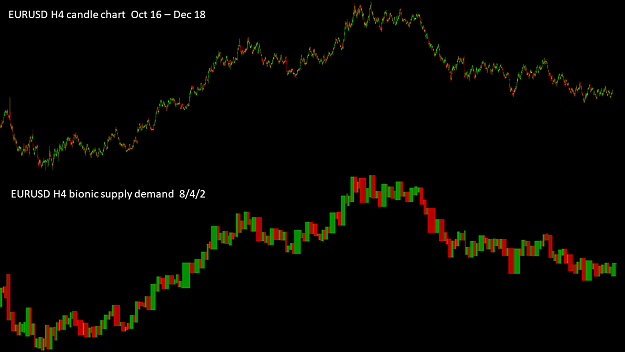
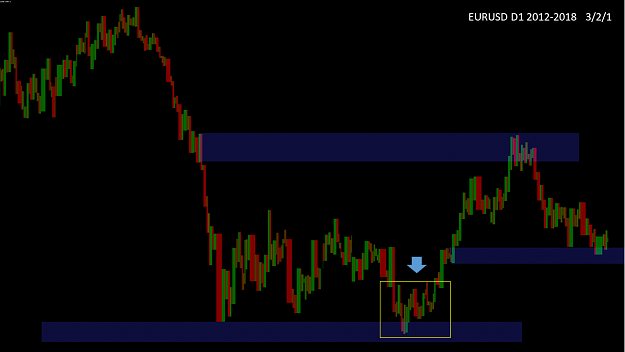
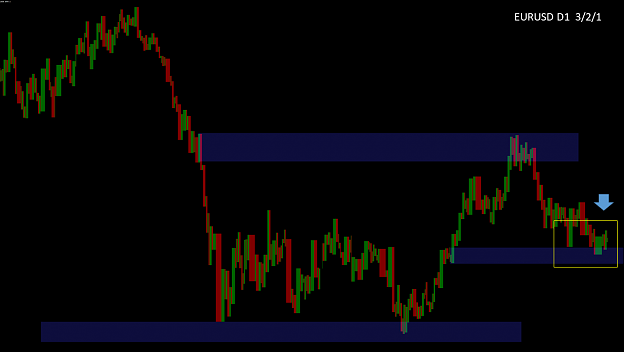
Now, looking at the current H4 chart, we can see (blue arrow) that in zone A has a very strong demand zone . This strong demand zone is a very good sign of a future further uptrend. Very interesting are the supply and demand zones if you look at them in smaller time units. I will publish some examples in the next few days.
I wish you another successful trading day and a nice evening.
best regards
Hello DonSergion,
Thank you, I am convinced that our work has been worthwhile. We now have a framework that allows us to visualize supply and demand in the chart, which we can now build on. Here is a little example:
Attached Image (click to enlarge)
From June 2017 to August 2017, we had a very strong demand market in the D1 chart. Within this very strong demand market, there were two very strong candle movements at points A and B. This resulted in two zones. You can see how well the price has reacted to this zone.
Attached Image (click to enlarge)
Now, looking at the current H4 chart, we can see (blue arrow) that in zone A has a very strong demand zone . This strong demand zone is a very good sign of a future further uptrend. Very interesting are the supply and demand zones if you look at them in smaller time units. I will publish some examples in the next few days.
I wish you another successful trading day and a nice evening.
best regards
Forget:That does not work, amateurs build the ark, pros the Titanic!
1