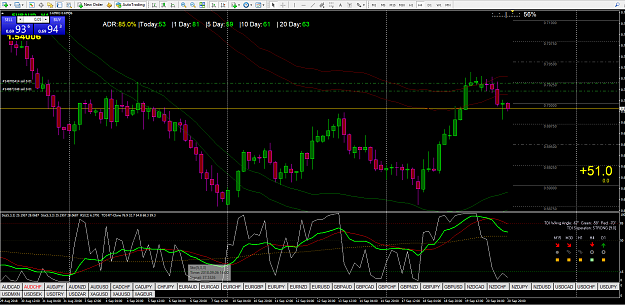
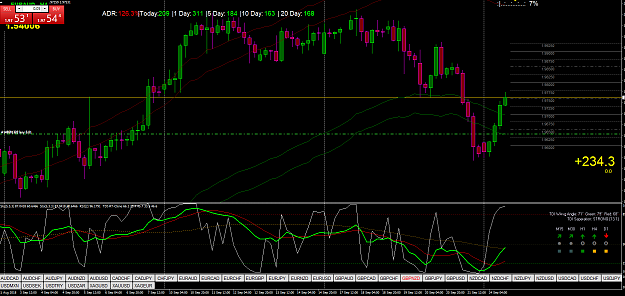
Disliked{quote} Hi, Yes the tdi is changing depending on te amount of bars you look at and how you scroll. The tdi indicator is placed in the same window as the rsi. This means that the tdi is exploded. If you also show the blue lines, you will see that the max value of the upper blue line and the min value of the lower blue line are about 90% of the range 0-100%. This is also the reason that in the DB you find 3 settings for the scaling. {image} BRIgnored
Or is the view the most zoomed the real one?
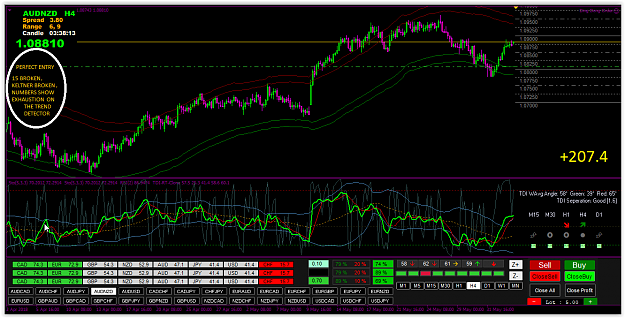
Anything above the line is an uptrend, below the line is a downtrend.