Hi folks.. Today I will continue to briefly explain how I generally draw trendlines while trading the M15 chart for EURUSD.. (The idea can be applied to any instrument though).
Below I shared 3 different trading days in a row. My trading day generally begins with London Opening and that hour is marked with a vertical line on these charts. I picked a random date from an area around 2015.. Doesn't matter at all. What matters are the important facts that I will explain below. I hope you can study the charts and grasp more information from them.
Because everything is expressed as a whole on charts, it can be confusing to just look at the charts alone. I recommend you read my comments and check the chart again and again for each paragraph that I am talking about. Meaning: Read one paragraph of my post and then go check chart. Then read next paragraph and check chart. And so on and so forth. Let's get started:
DAY (Chart) 1
For any new day we don't need to know what happened the day before or where are all the important S/R levels on higher timeframes etc. are located. Those can help yes but they are really not necessary. Our job will be to check specific signs first which I have listed below:
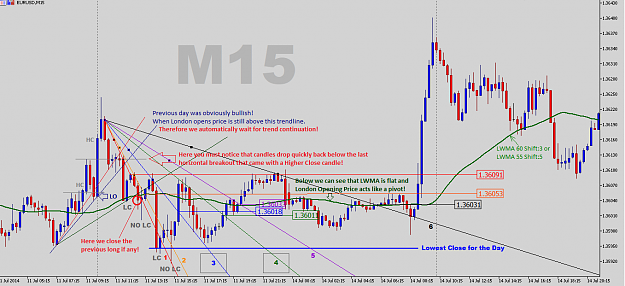
The first thing I always check is: Where are the candles opening or positioned based on the GREEN MA LINE (60 Linear Weighted Moving Average, Shifted: 3). (You can also use the 55 LWMA Shifted: 5 as your settings. These settings will never be 100% perfect. It is only a guiding line to see the overall trend as quick as it gets).
My second check is the slope of the LWMA: If the slope is flat I know that it could require some time until a breakout or that I can expect the market to go sideways for a while. But it doesn't preclude me from opening a trade once a breakout occurs. I am simply waiting for the perfect moment because I know that market probably arrived at a decision zone.
Third check is London Opening Price: In our example right after London opening, new candles close higher. Therefore I would keep my previous long if any. But as soon as two red candles drop back below previous Higher Close (HC) Level, I would get suspicious and look to a place to close my long trade. It would be a cautious close for this case only. But because that the day right after London Opening started with a higher close I would still have a bullish bias,
4th check is closing or let runnning trade from previous day: Since I had a long trade already open here I would close it after a breakout from ascending blue trendline. The red trendline would be a too early breakout signal. I generally ignore red trendlines (steepest trendlines). I will explain soon why. Keep reading.
So now that I stated that I would have a bullish bias I would expect trend continuation. So with a breakout to below I would first close my long temporarily at the price I circled in red. (Yes I know I am giving back some of my profits but this case is really rare. Important is to stick to the system no matter what. Later we can improve these kind of situations with trailing SL, but overall it is really not important. In the longer run we always will get better profits.)
Drawing Descending Trendlines for Bullish Breakout
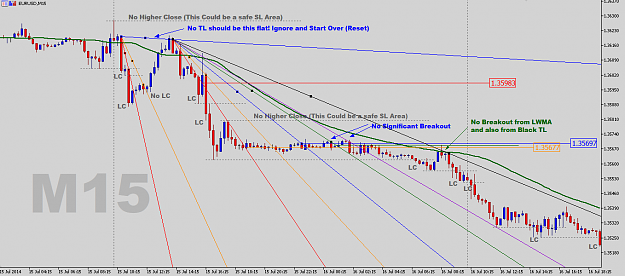
After I closed my long and started waiting on sidelines I am checking if I can start drawing a descending Trendline. So this part is the main reason why I prepared this post in the first place. Let's assume I am drawing lines from all potential highest swing high to lower swing highs. On chart 1 that way I could draw 6 different descending trendlines. Which one is the one we should refer to? All of them could be the potential real trendline? How will we know where the best breakout price is?
Here is the answer:
- The RED Trendline, marked with number 1: This is a steep line and often I ignore the red trendlines. Those will cause you to cut profits early. Ignore!
- The ORANGE Trendline, marked with number 2: For this line I look when it happened. This retracement happened after a Lower Close!!!! Don't start drawing descending trendlines in a bearish trend when you still have a lower close. So orange line is ignored as well.
- The BLUE Trendline, marked with number 3: That retracement could not print a new lower close. Now we can start drawing our first trendline. That level could give us a correct angle. But it is not the only one. Next trendline also has such a function.
- The GREEN Trendline, marked with number 4: If yu check market prints a new lower close first. Then it makes a little swing high. That level is already below the blue so we ignore. But then it makes a new low with the shadow but can't close lower. Then it makes a swing high and therefore that level also can be count as a proper place to draw the trendline. I did these two trendlines are both legit. (I put them into gray boxes on chart).
- The PURPLE (Numbered 5) and BLACK (Numbered 6) Trendlines: I just put them because we can still draw more trendlines for every swing high. But these just make no sense anymore. So ignore them. But check out their breakout levels. Those levels are already similar to 3 and 4 and therefore we don't need them. We must focus on number 3 and 4 type of trendlines.
- Now you understand why I also didn't use the red trendline to close long trade from previous day.
Okay, so since I have a bullish bias and I was waiting for a bullish breakout. Once that breakout occurs through BLUE trendline (Nr. 3) or GREEN Trendline (Nr. 4) I immediately open a long trade at one of these levels. And start watching what happens next.
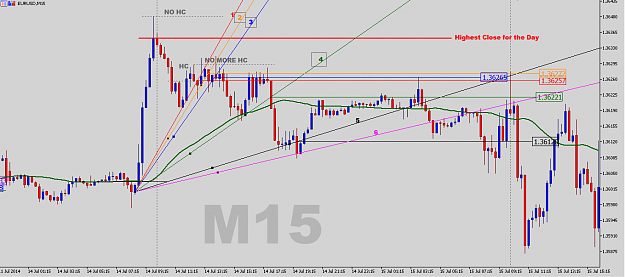
- I keep watching the candles and I notice that there comes no more candle close below the day's lowest close (or shadow) and I feel confident. I also notice that I opened my long just below London Opening price so I know that could buy low in this case which is what you hear a lot from pro traders: buy low.. sell high.. this is how you can do it.. Without a proper system like this nobody would feel like buying below London Opening.. but that is the trick. Buying low requires us to buy at weird places. You must learn to buy at zones that are out of your comfort zone. Feels weird but it is the only way to get a chance later to run away with minor loss if things go against you.
So.. for day 1 you now can study and try to understand why I am using only closing or opening prices of candles. Think of candle wicks as jumps of a kid for an apple that hangs on a branch of a tree. He can not grab the apple but he can touch it. So wicks give traders little confidence but they are not enough. But just like the little kid would grab the apple and pull it down is same to the candle close. The grabbnig moment of the hand to the apple is same as the closing price of candle. The kid is more confident to try to jump to higher apples. So is the market to try closing higher. Every new higher close than previous wick is most important for trend continuation.
So this was a long post for chart 1... I will continue explaining chart (day) 2 with next post.. coming soon.. first will have dinner..
Stay Green