I know many of you may have already noticed this fact or known this by different names; but I thought I hadn't seen a thread dedicated to this (at least I haven't noticed). We wanna discuss Time + Distance!
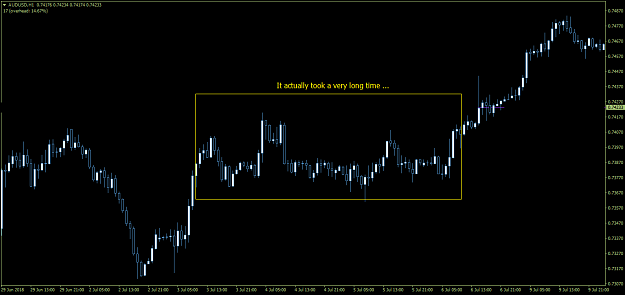
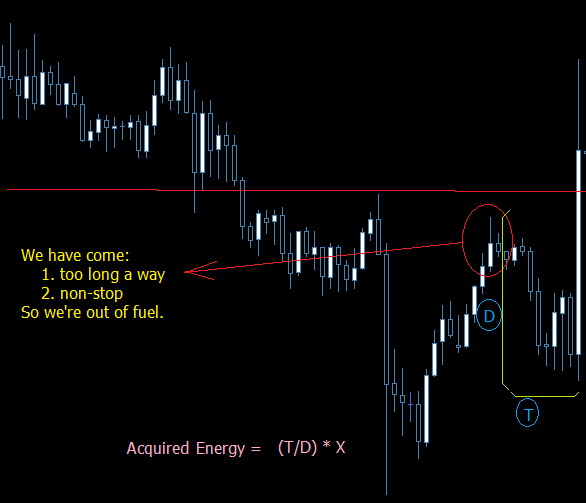
I believe, the more the price proceeds non-stop in any given direction, the less energy or fuel it's left with in order to go further and, more importantly, to break a swing point (support/resistance).
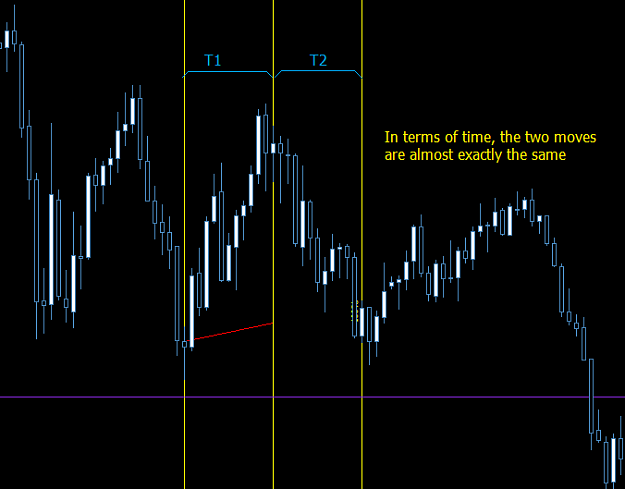
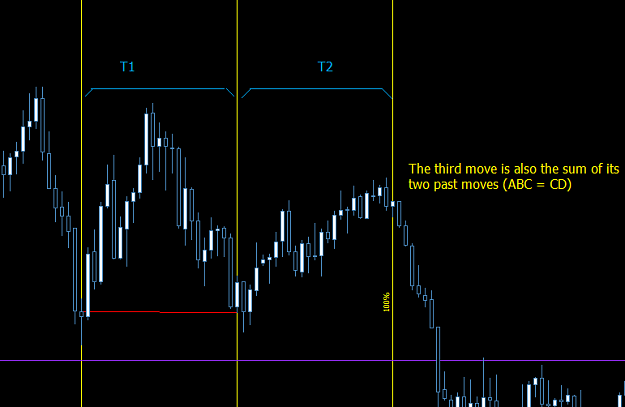
The energy it has acquired in order to make a higher high or a lower low (i.e. to break through a support/resistance level) has a direct relationship with the time spent since the first failed attempt and an inverse relationship with the retracing distance. Please note that by «time» I mean the number of candles that appear between two events and not the time of the day etc.
So I invite you to share your thoughts and experiences in regard to the following thesis. It's a «discussion» forum after all
I believe, the more the price proceeds non-stop in any given direction, the less energy or fuel it's left with in order to go further and, more importantly, to break a swing point (support/resistance).
The energy it has acquired in order to make a higher high or a lower low (i.e. to break through a support/resistance level) has a direct relationship with the time spent since the first failed attempt and an inverse relationship with the retracing distance. Please note that by «time» I mean the number of candles that appear between two events and not the time of the day etc.
So I invite you to share your thoughts and experiences in regard to the following thesis. It's a «discussion» forum after all
Attached Image
If you can't measure it, you can't improve it!