EDTT - Post BackTest Analytics, Trade Cost Assumptions and Risk Weighting - Discretionary Systems
.......continued from post 2050
Now this is going to be a sad saga that we need to appreciate as every silver lining has a cloud....(*mmmmmm a bit of poetic licence here*)......better put on some uplifting music to try and keep us entertained for this sobering tale.
Before we can pluck the courage up to launch into our live trading following our exciting backtest results, now comes the time to remove any bullish euphoria and focus on the reality of live trading. We do this to dampen our expectations and ensure our risk weightings are correctly applied for live conditions. This is where the brutal reality of the frictional costs of trading need to take center stage....as we inevitably incur additional costs to that anticipated from our backtests attributed to the realities of live trading.
This process makes us exceedingly aware of the very thin slice of alpha that we actually possess, and how the frictional costs of trading inevitably add up to be one of the biggest banes of our existence. What previously was a glorious compounding equity curve get's hammered to death by the thieving middle fingers of the brokers who place our trades.
Spread
Ok....so fortunately spread from Dukascopy has already been incorporated into the results, but if you use a different broker then you need to ensure that the true costs of spread and commission are reflected in your results. For the purposes of this backtest and going forward, we will be using Dukascopy so we have already taken this into account.
In a nutshell the cost of spread for Dukascopy across our universe is approximately $40 per round trip risking $500 on a $200K account or 0.25% trade risk%....This therefore represents 8% of your trade risk %. On a total of 1176 trades on a 0.25% trade risk we chew up approximately $47K in commissions which represents approximately 26% of our gross profit before commissions......that's right.....read it and weep. That is the privilege of paying those kind generous brokers we love.
SWAP
....but it doesn't end there....now we need to add to our misery by adding the costs of SWAP to our returns to pay the holding costs associated with trading leveraged instruments. You brokers will declare that sometimes you can make money on your SWAP dependent on inter-bank lending rates.....however that is the exception as opposed to the rule.
We have a guide to use to load up our return distributions with an estimated total SWAP costs for trades with an average duration of 12 days hold.......are you ready for it?.......be prepared to take an additional $20 per round trip of your equity curve or half of your spread costs again......and you are lucky because if your average hold extends out to the months....then SWAPs of up to 3 x your total commission costs are fairly standard.
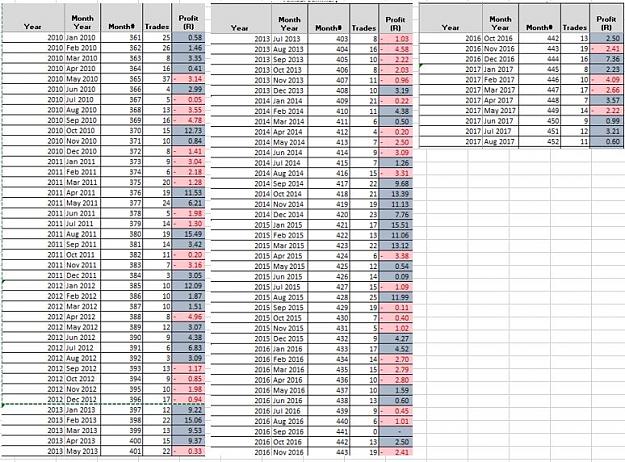
For example below is a mid-term trend following strategy across a broad universe of instruments from Avatrade where I have highlighted SWAP costs that extract 25% of your Gross Profit. Now you can probably understand why MT4 very carefully does not fully disclose the costs of trading in your strategy tester. It's embarrassing isn't it?
Slippage
....but wait.....you want more don't you? Ok here goes.What about that dreaded word we love to hate called slippage. For breakout traders, this is an inevitable issue you just have to accept. Unfortunately we enter trades at the very worst times under high momentum where brokers love to launch the excuse of trade slippage to state why your pending orders were not triggered at the right price.....so how much should we assume?
Well given that sometimes you don't slip but at other times your slippage can be quite extreme the best we can do is apply an average slippage per trade. For the purposes of this exercise and from past live experience I am applying a fairly realistic 2% slippage for every trade which eats into your total gross profit by about 4% for the privilege.
Other Frictional costs
For the purposes of this exercise we are ignoring trader error which in the world of discretionary trading can be materially significant...however let's just say that the assumptions so far could positively or negatively materially differ from what's stated...however at least for this exercise we have significantly diluted our expectations by at least incorporating more realistic assumptions into the results.
So what are the material impacts to our equity curve?............for those who have anxiety, it is probably best to look away now.
Before
After
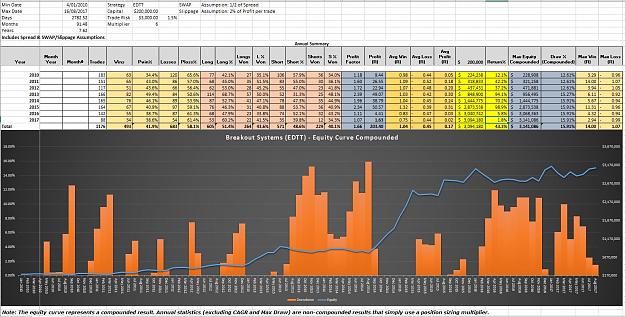
Comments
Take some time to familiarize yourselves with the performance metrics above as it demonstrates how the majority or the gross profits generated by your system are distributed to your brokers and other intermediaries and how you only have a very slender thin slice of alpha to actually play with. The impact is significant on compounded accounts. Just to drum it in, what previously was a 61.4% CAGR with a Max Drawdown of 11.63% is now a CAGR of 43.3% with a max Drawdown of 15.91% and we still have some work to do in reducing our expectations further by scaling our portfolio to our Max Drawdown tolerance of 10%.
Continued on next post......
Cheers
C
.......continued from post 2050
Now this is going to be a sad saga that we need to appreciate as every silver lining has a cloud....(*mmmmmm a bit of poetic licence here*)......better put on some uplifting music to try and keep us entertained for this sobering tale.
Inserted Video
Before we can pluck the courage up to launch into our live trading following our exciting backtest results, now comes the time to remove any bullish euphoria and focus on the reality of live trading. We do this to dampen our expectations and ensure our risk weightings are correctly applied for live conditions. This is where the brutal reality of the frictional costs of trading need to take center stage....as we inevitably incur additional costs to that anticipated from our backtests attributed to the realities of live trading.
This process makes us exceedingly aware of the very thin slice of alpha that we actually possess, and how the frictional costs of trading inevitably add up to be one of the biggest banes of our existence. What previously was a glorious compounding equity curve get's hammered to death by the thieving middle fingers of the brokers who place our trades.
Spread
Ok....so fortunately spread from Dukascopy has already been incorporated into the results, but if you use a different broker then you need to ensure that the true costs of spread and commission are reflected in your results. For the purposes of this backtest and going forward, we will be using Dukascopy so we have already taken this into account.
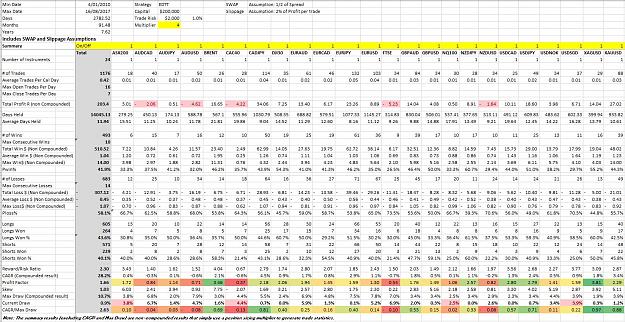
In a nutshell the cost of spread for Dukascopy across our universe is approximately $40 per round trip risking $500 on a $200K account or 0.25% trade risk%....This therefore represents 8% of your trade risk %. On a total of 1176 trades on a 0.25% trade risk we chew up approximately $47K in commissions which represents approximately 26% of our gross profit before commissions......that's right.....read it and weep. That is the privilege of paying those kind generous brokers we love.
SWAP
....but it doesn't end there....now we need to add to our misery by adding the costs of SWAP to our returns to pay the holding costs associated with trading leveraged instruments. You brokers will declare that sometimes you can make money on your SWAP dependent on inter-bank lending rates.....however that is the exception as opposed to the rule.
We have a guide to use to load up our return distributions with an estimated total SWAP costs for trades with an average duration of 12 days hold.......are you ready for it?.......be prepared to take an additional $20 per round trip of your equity curve or half of your spread costs again......and you are lucky because if your average hold extends out to the months....then SWAPs of up to 3 x your total commission costs are fairly standard.
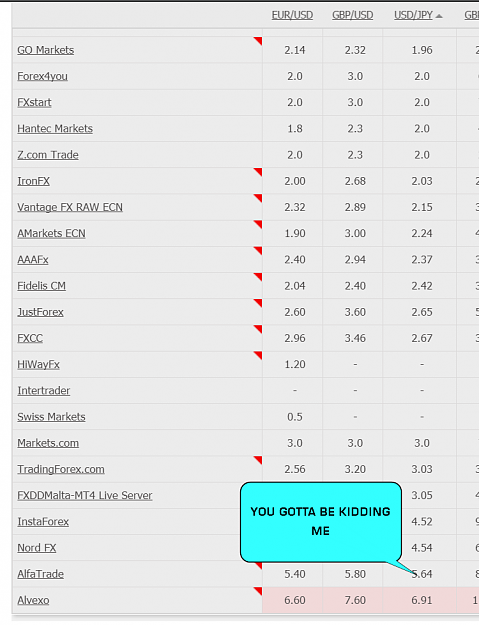
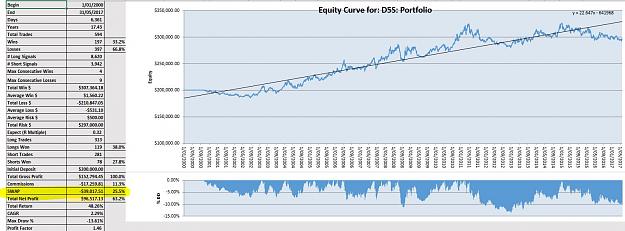
For example below is a mid-term trend following strategy across a broad universe of instruments from Avatrade where I have highlighted SWAP costs that extract 25% of your Gross Profit. Now you can probably understand why MT4 very carefully does not fully disclose the costs of trading in your strategy tester. It's embarrassing isn't it?
Attached Image (click to enlarge)
Slippage
....but wait.....you want more don't you? Ok here goes.What about that dreaded word we love to hate called slippage. For breakout traders, this is an inevitable issue you just have to accept. Unfortunately we enter trades at the very worst times under high momentum where brokers love to launch the excuse of trade slippage to state why your pending orders were not triggered at the right price.....so how much should we assume?
Well given that sometimes you don't slip but at other times your slippage can be quite extreme the best we can do is apply an average slippage per trade. For the purposes of this exercise and from past live experience I am applying a fairly realistic 2% slippage for every trade which eats into your total gross profit by about 4% for the privilege.
Other Frictional costs
For the purposes of this exercise we are ignoring trader error which in the world of discretionary trading can be materially significant...however let's just say that the assumptions so far could positively or negatively materially differ from what's stated...however at least for this exercise we have significantly diluted our expectations by at least incorporating more realistic assumptions into the results.
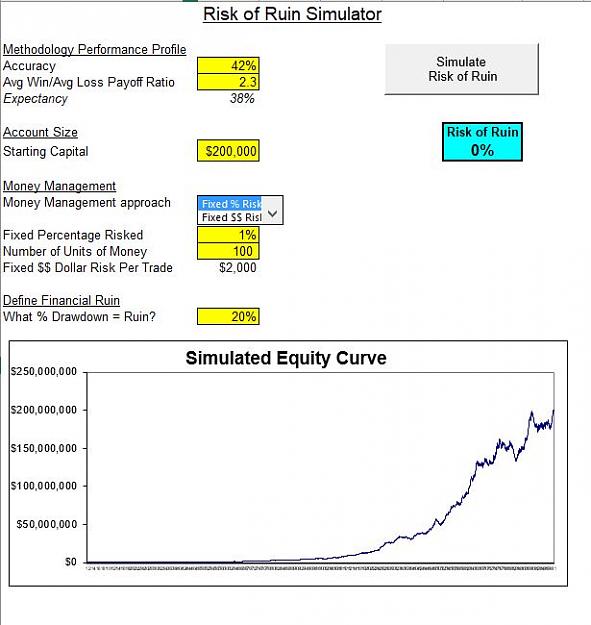
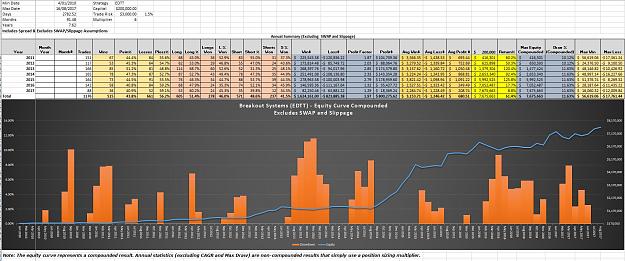
So what are the material impacts to our equity curve?............for those who have anxiety, it is probably best to look away now.
Before
Attached Image (click to enlarge)
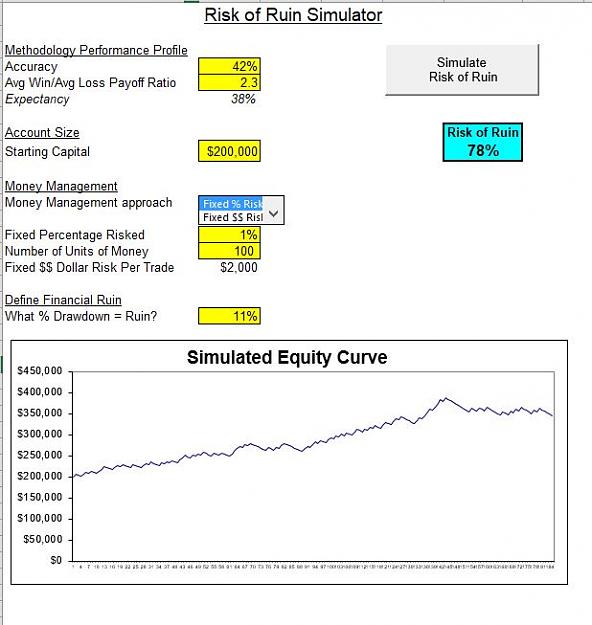
After
Attached Image (click to enlarge)
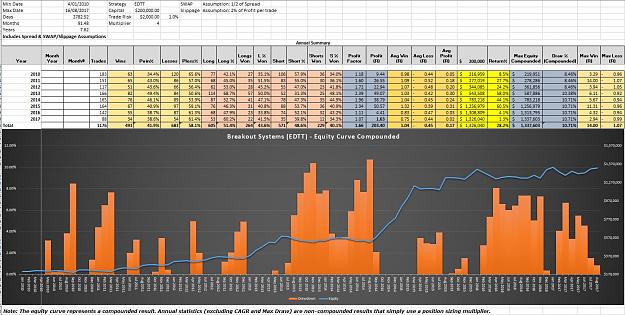
Comments
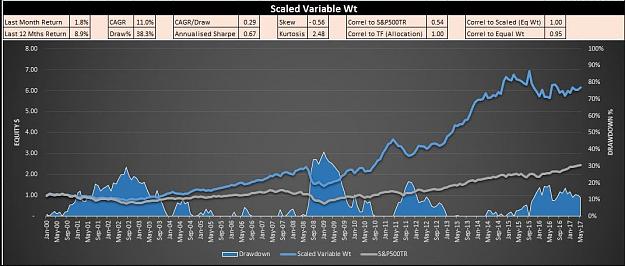
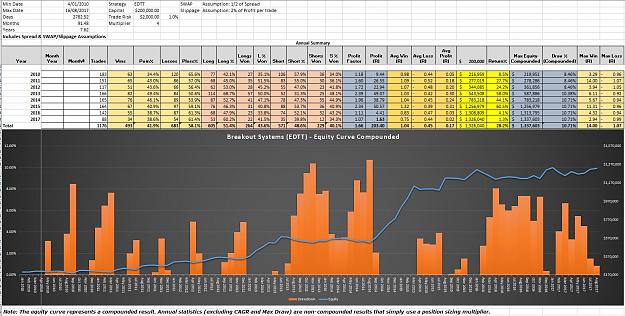
Take some time to familiarize yourselves with the performance metrics above as it demonstrates how the majority or the gross profits generated by your system are distributed to your brokers and other intermediaries and how you only have a very slender thin slice of alpha to actually play with. The impact is significant on compounded accounts. Just to drum it in, what previously was a 61.4% CAGR with a Max Drawdown of 11.63% is now a CAGR of 43.3% with a max Drawdown of 15.91% and we still have some work to do in reducing our expectations further by scaling our portfolio to our Max Drawdown tolerance of 10%.
Continued on next post......
Cheers
C
5