- Search Forex Factory
- 48 Results
- tornado11 replied Jul 16, 2011
Check this out — Chart #1, compare these to whats going on now.
Circular Trendlines
- tornado11 replied Jul 15, 2011
Reasons for Bullish ( CANDLE STICK ) — Monthly: Lets look at the Monthly chart here first. We got a solid break of a major support DTL and tested 3 times failed to break. We have also had an Inside Bar broken down on the short side but failed ...
Circular Trendlines
- tornado11 replied Jul 15, 2011
My view — Something has just occoured to me that a pattern called an Inside Bar has been broken on the 4hr to the bottom side but did not close. If it breaks the top side which is at 4695, that is what my trading Guru calls an inside bar ...
Circular Trendlines
- tornado11 replied Jul 15, 2011
Yea — VSA is about the best strategy I have seen and I am just getting the hang of it. Once you know where the professional money is you got this thing licked and I am working on it, but I have got a lot to learn but it is coming fast. My 4400 ...
Circular Trendlines

- tornado11 replied Jul 15, 2011
Dam — Should have stuck to my guns. Looks like DB on the 1 hr. 4100 May be all.You have to remember, the E/U bounces off the 38% level about as often as it does the 61.8% level. It has tried 3 times and failed to break it. In a nutshell, we ...
Circular Trendlines

- tornado11 replied Jul 15, 2011
Scenario — Here is a scenario that falls in line with your call, Kam. The 4 hr drop to 61.8 % is 1.4000 area. This would probably give that 4 hour VSA chart that selling climax that we desperately need. The Professional selling is waning so it ...
Circular Trendlines
- tornado11 replied Jul 15, 2011
Nice job — There is your move. Was kinda hoping to see a downthrust and possibly more, otherwise this up move that started the other night would not make sense. The 4hr is showing a Bull flag and a stopping volume down to test the 1.400 area ...
Circular Trendlines
- tornado11 replied Jul 14, 2011
I think she is done — I dont think she will go down much more. I am getting 4 hr signals onVSA that Selling interest is waning. See below. Also, pair came back to exactly 38 % fib level of the Daily move up, bottom chart.
Circular Trendlines


- tornado11 replied Jul 13, 2011
In VSA mode — Looking for more entrys off the 15 Min. Got a test bar but we need more than that. This pair needs a rest so look for a bull flag.
Circular Trendlines
- tornado11 replied Jul 13, 2011
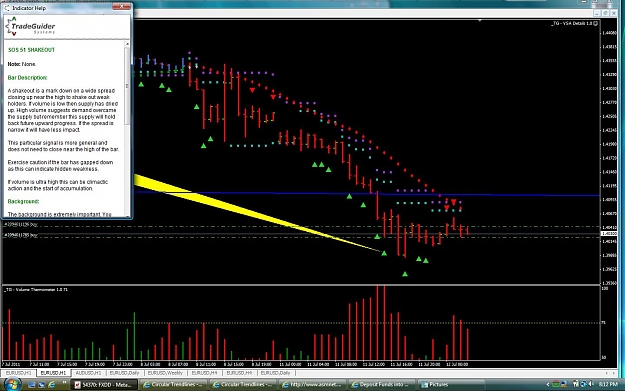
Shakeout — In my opinion, from Sunday night till yesterday has been one big shakeout on a huge scale, more directly, a weekly scale. VSA and volume have shown that professional interest in shorts was gone, and you could see the buying on the ...
Circular Trendlines
- tornado11 replied Jul 13, 2011
Can you explain — You have said the overall trend is down, can you please explain. Because I see it as still being up. And I understand depending on the way you look at it, it could be both. So let us change our meaning a bit and do what we ...
Circular Trendlines
- tornado11 replied Jul 13, 2011
False Break — I am willing to bet that is all it was. Time will tell. Just look at the Monthly Fallin Wedge and see how it has 3 times tried to fall back into this area and has failed miserably each time. I believe we are on our way up. ...
Circular Trendlines
- tornado11 replied Jul 13, 2011
Ok — Getting close to Daily resistance, so I just pulled 3/4 of my load off. I will wait for a pullback and some good VSA signals to buy some more, probably toinght.. Daily Stoch has crossed and this is turning out to be a Morning Star ...
Circular Trendlines
- tornado11 replied Jul 13, 2011
So you see — That small loss I took on the 1 Hr signal, has turned into $$$$$ on the 4 hr signal. And the Daily bounce off the 200 SMA is icing on the cake. Just remember, the higher the timeframe the more dependable the signal. Now, there are ...
Circular Trendlines
- tornado11 replied Jul 12, 2011
Agreed — Totally understood my man, I was just pointing out that a pin off the 200 is a more likely to bounce than just a pure pin. Got to remember, if you really, really really want to get technical, the long term trend is still up! See chart. ...
EURUSD
- tornado11 replied Jul 12, 2011
Ahhh yesss — A Daily Pinbar yes, but a pinbar bouncing off the 200 SMA. Now I mean a fricking springboard bounce, and that is a completely different animal, wouldnt you say my friend.
EURUSD
- tornado11 replied Jul 12, 2011
Most important chart — Hey guys, here is the most important chart we got going. It is the 200 SMA and the Stochastic os. THIS IS A DAILY CHART FRIENDS. The 200 SMA and the Stochastic os. have been used on the Daily chart for years!The first ...
Circular Trendlines
- tornado11 replied Jul 11, 2011
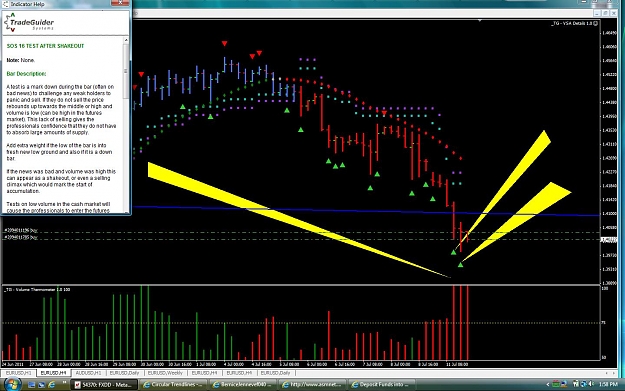
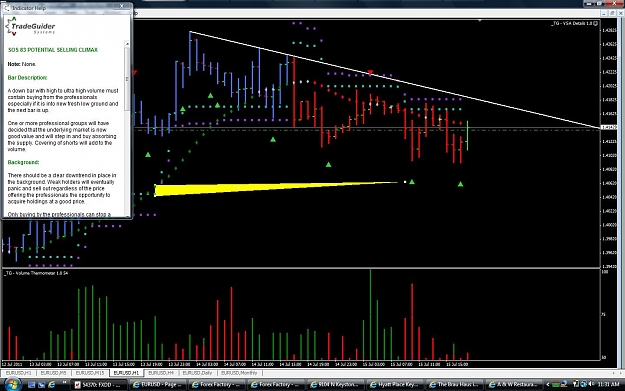
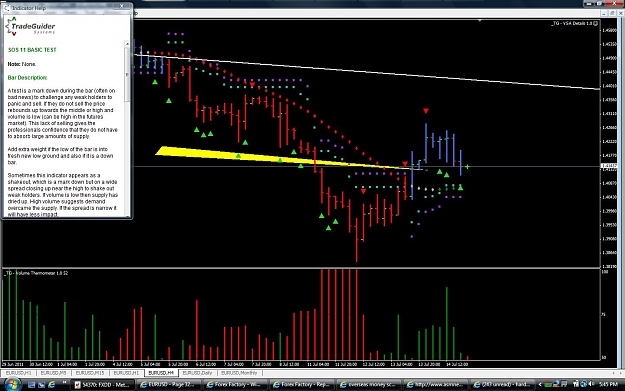
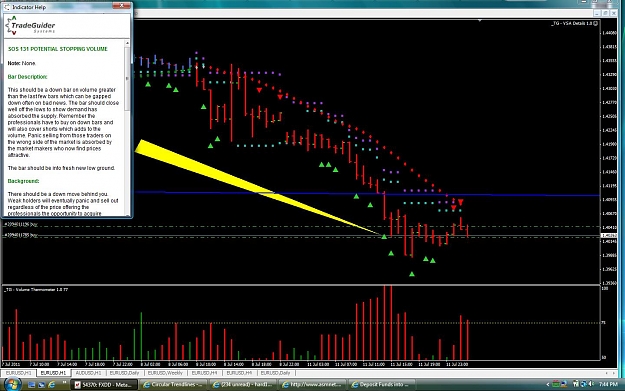
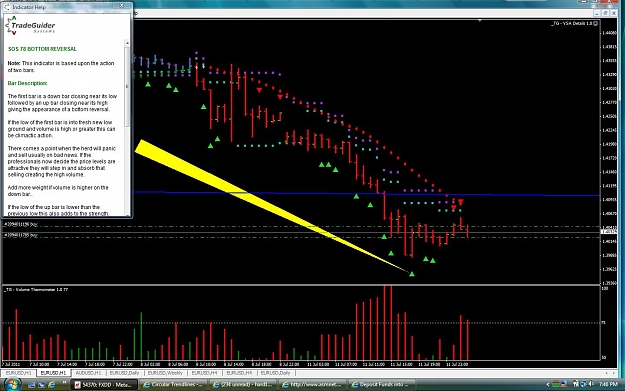
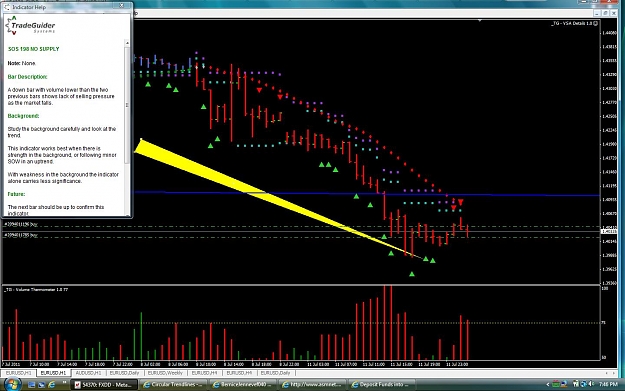
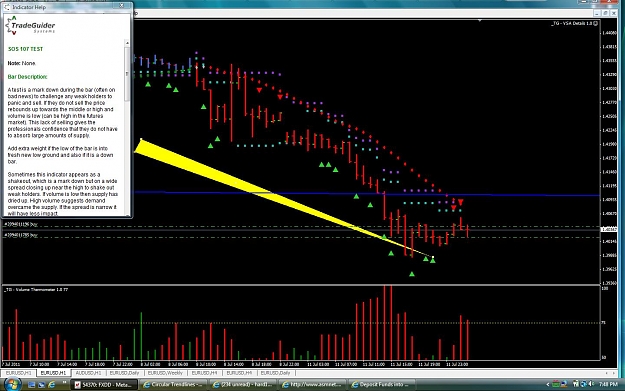
Okie Dokie — Disclaimer: Guys, I am a long term trader, usually off the daily and 4 hr, with entries off the 1 hr. That being said, here we go with my entry material. Below we have 6 charts in the VSA variety. Chart #1 shows a potential ...
Circular Trendlines
- tornado11 replied Jul 11, 2011
Heres what we been looking for. — This is showing professional buying has started thruout the day. Anytime you habe bars pushing down on Ultra high volume and closing back in the middle, something is up my friend. got my trades in and Got to ...
Circular Trendlines