- Search Forex Factory
- 14 Results
- seb123 replied Feb 8, 2008
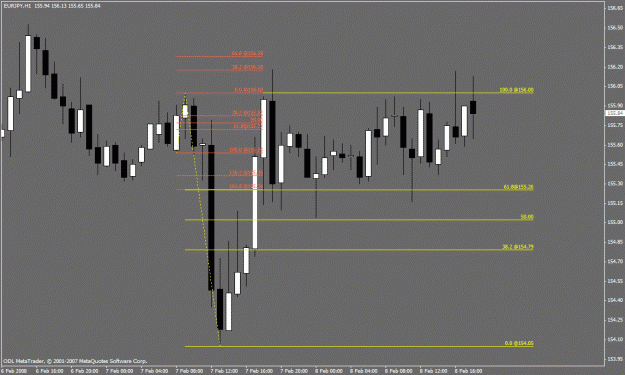
ej fibs — Hi I'm looking at the EJ too, I've got my fib as in the chart. The price reversed before TP, but I believe that is because its hit another earlier fib target. I'm now waiting for it to return to its upward cycle. LoloAC, I believe ...
Indicator Free Trading - Skunny
- seb123 replied Feb 5, 2008
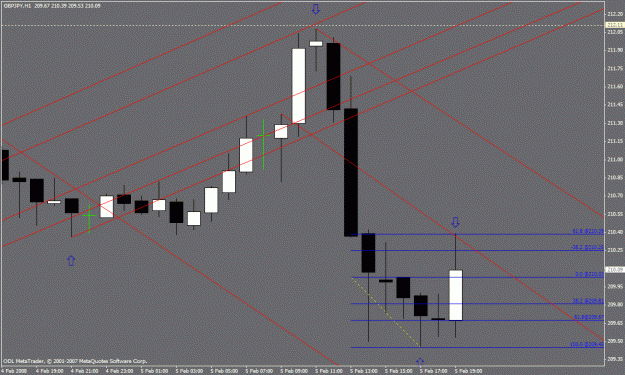
Gann line — Hi All, I started playing with Gann lines and this interesting situation just occurred, as some of you are into Gann lines, I thought you'd like to see it. Anybody else got this, is it a fluke? (some of my lines are not quite ...
Indicator Free Trading - Skunny
- seb123 replied Feb 5, 2008
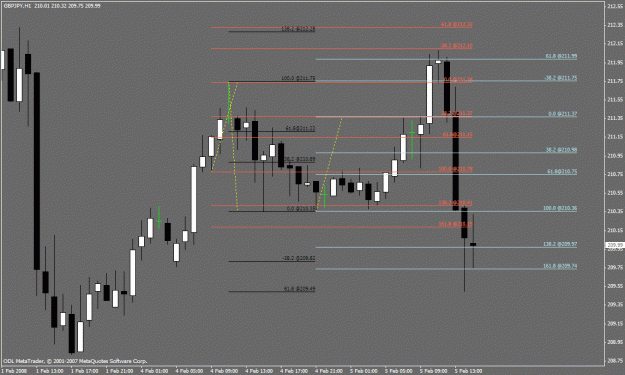
GJ fib — Hi Dagoods, IMHO, the chart below will show why your black fib "failed". The up cycle completed at the 138 level (red fib, 2 pips out, but price reversed). This cut short your black fib, but it didn't fail IMHO. You could have traded ...
Indicator Free Trading - Skunny
- seb123 replied Feb 1, 2008
fib charts —
Indicator Free Trading - Skunny what???? ok I'll post my current chart, but not previous swings. Things to do man, places to go, people to see etc.
  Take a look at my earlier posts and let me know if they don't make sense to you. On the chart, the ...
- seb123 replied Jan 31, 2008
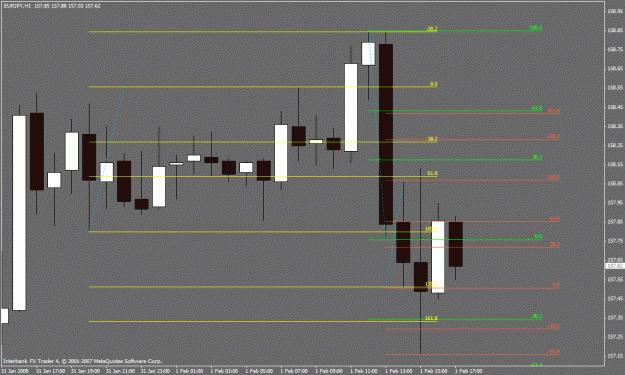
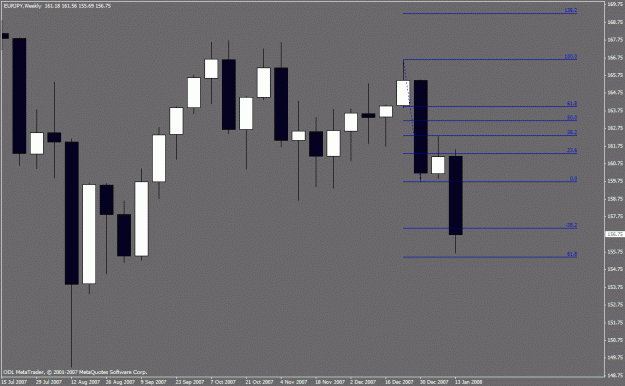
EU fibs — Hi Duncan, ok here's my crack at this. First chart shows long swings, but not a close hit. 2nd chart shows a small fib in blue, when the 138 is hit there isn't another valid fib to call on. I moved the fib to the first real s/r ...
Indicator Free Trading - Skunny
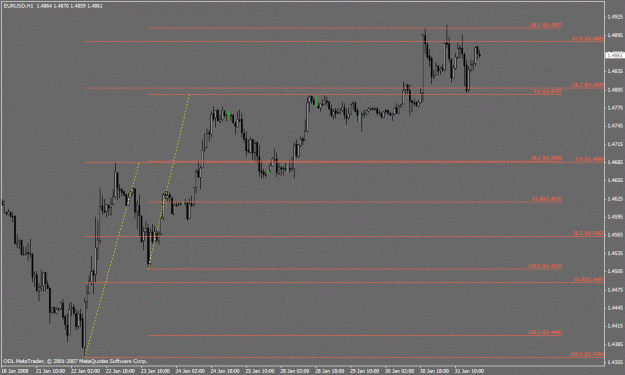
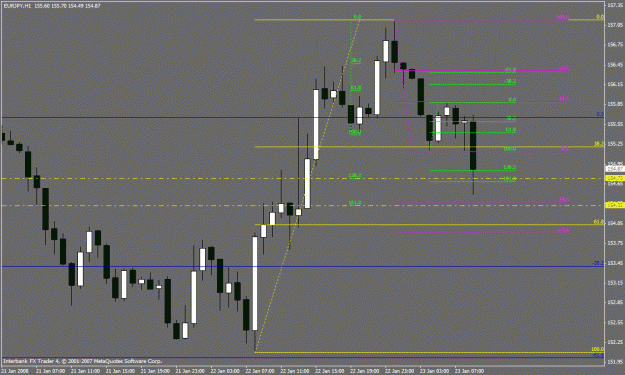
- seb123 replied Jan 24, 2008
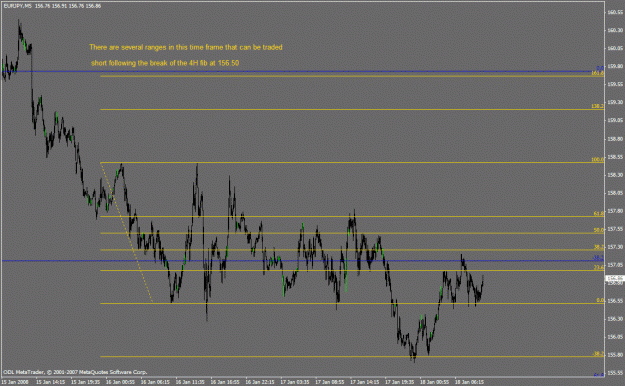
more EU fibs — Hi piphitman, here is another chart showing myfibs for the up move on EU. The first green fib hits target then the magenta fib takes over walking it up until the first high after the 138 tp reached. The 138 level of this is the ...
Indicator Free Trading - Skunny
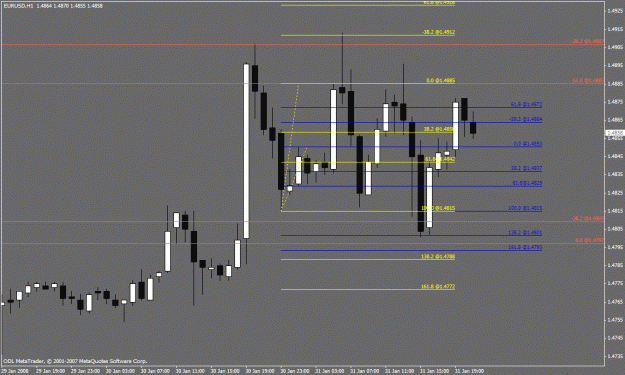
- seb123 replied Jan 24, 2008
EU downmove — Hi , this is how I fibbed the downmove on the EU. The magenta fib is the green fib, moved to the new low after target hit. The down move hits the target to the pip.
Indicator Free Trading - Skunny
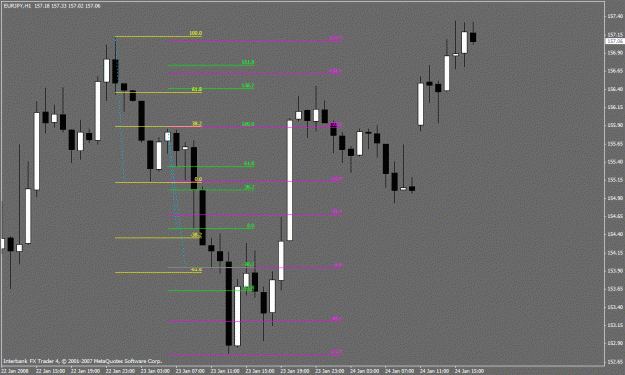
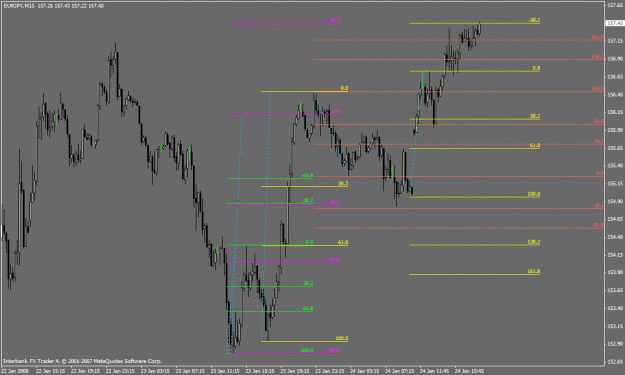
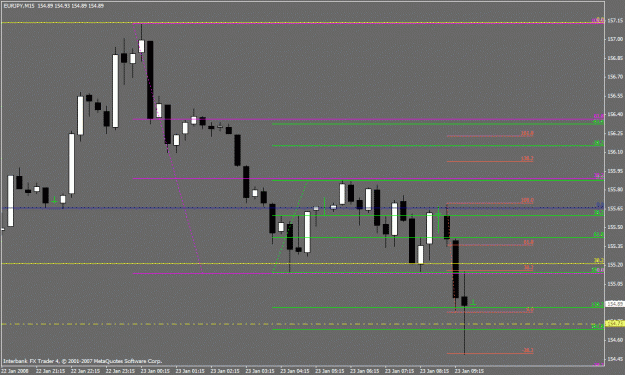
- seb123 replied Jan 23, 2008
ej charts — Hi piphitman, thanks for that. here are a couple of EJ charts, the first shows my hourly fibs, the 2 green have reached their targets but price has abruptly stopped in no mans land. Chart 2 shows a 15m chart and the red fib shows ...
Indicator Free Trading - Skunny
- seb123 replied Jan 22, 2008
chart — Sizz, you caught me taking a break so I had a quick look at your chart. here are some fibs that I could find, I think a few hit to the pip.
Indicator Free Trading - Skunny
- seb123 replied Jan 22, 2008
GU daily chart — Hi Sizz, here is my GU daily chart, the green fib for the 2 bar range corresponds to Skunny's hourly set up from yesterday. I had several more single and double bar fibs on here but it was a real mess, too much grape juice I ...
Indicator Free Trading - Skunny
- seb123 replied Jan 20, 2008
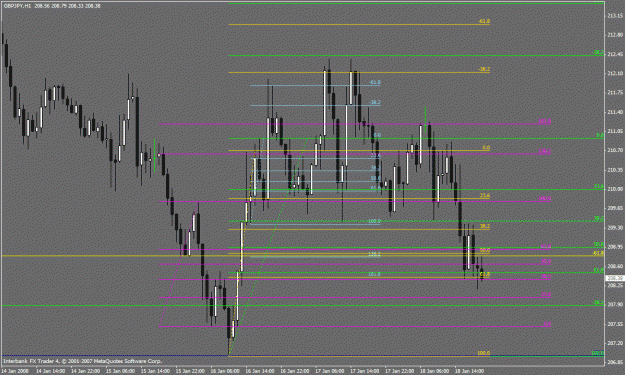
Hi 24, I'm having another stab at this because I think its important to nail things that seem not to work as we expect. I'm finding i'm learning a lot by doing it too. In my chart I have posted 4 H1 ranges which could ALL have been drawn in real ...
Indicator Free Trading - Skunny
- seb123 replied Jan 19, 2008
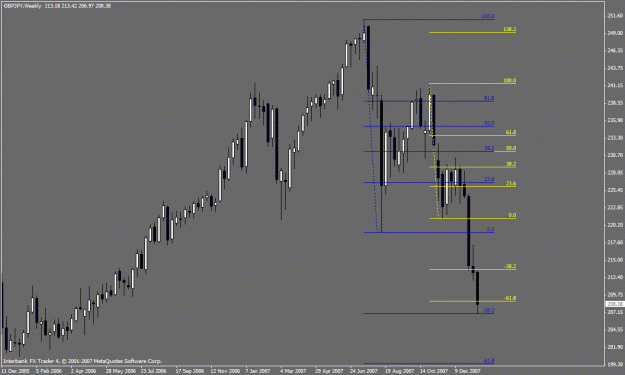
PA — Hi 24, I've just taken a look at your chart and come up with this view. Take a look at my charts below. The weekly chart shows 2 fibs, the profit targets for both are hit and the low is pip perfect at the 138 ext of the blue fib. The Blue ...
Indicator Free Trading - Skunny

- seb123 replied Jan 18, 2008
light bulb moment — Things have suddenly got a lot clearer for me in the last few days, putting all the comments together has helped me to make sense of it all. Thanks to everyone for your input. Before I go into it, Skunny said a few posts ...
Indicator Free Trading - Skunny
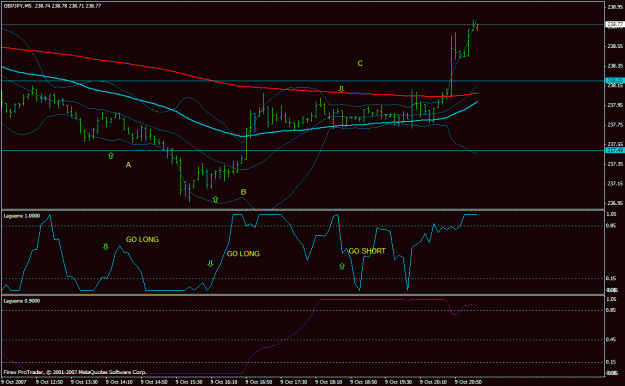
- seb123 replied Oct 9, 2007
clarification needed — Hi Imran, I'm just getting to grips with your system and I think it is very good. I just need a few things clarifying though if you would please. I've got 3 signals on the attached G/J and I'll explain how I read them ...
Simple Method of Scalping any pair on 5 min chart , specially GBP/JPY - by Imran Sait
- Posts by Member Search: 'seb123'