- Search Forex Factory
- 612 Results (3 Threads , 609 Replies )
-
 robots4me replied Apr 19, 2022
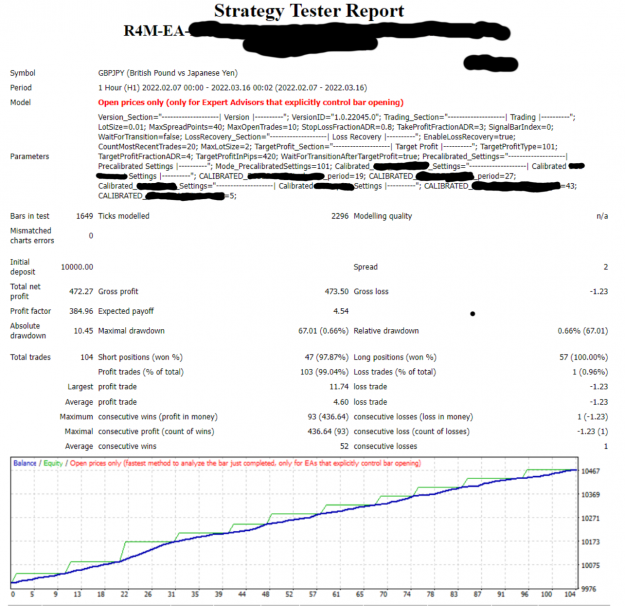
So, you know -- you are right. My apologies to you @lynnc -- I stand corrected. His deposit was not included in Gross profit and the PF for that chart truly is 4.18. Yes -- I've made an ass of myself. Not the first time and, hopefully, not the ...
Trading Made Simple
- robots4me replied Apr 8, 2022
Son -- isn't true life often funnier than fiction? Here' you're suggesting that I should get a life and then you post a picture showing us that yours is sideways...
Trading Made Simple Now -- that's the definition of ironic (if @vnechev ...

- robots4me replied Apr 7, 2022
Hey son -- I care about you, too, as well -- even more sincerely than you care about me...
Trading Made Simple As for my mental issues -- yep, well documented. And those don't even include the ones my wife would love to share with you... And as for ...
- robots4me replied Apr 7, 2022
You did!!! In your prevous post!!! Another genius here -- no wonder DrDave has taken you on as a sidekick... image
Trading Made Simple
- robots4me replied Apr 7, 2022
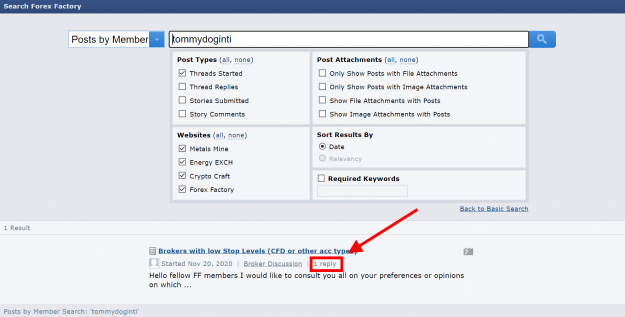
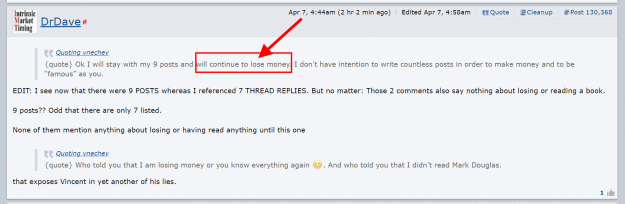
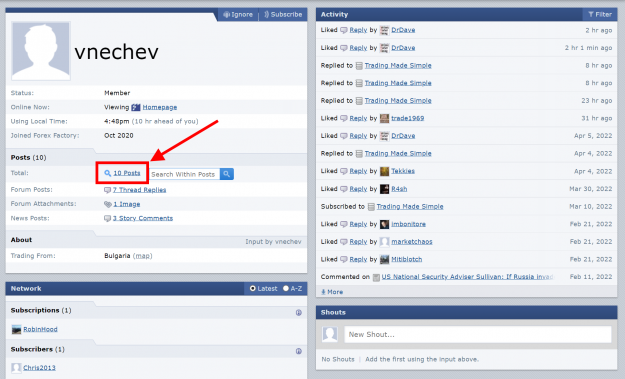
DrDave -- does blind like a bat apply to you, as well? FF shows 10 posts -- so, @emmanuel7788 was correct and you, sir, are wrong. image And as for @vnechev losing money, he says so in his own post -- the one you quoted. Are you going to beg ...
Trading Made Simple

- robots4me replied Apr 7, 2022
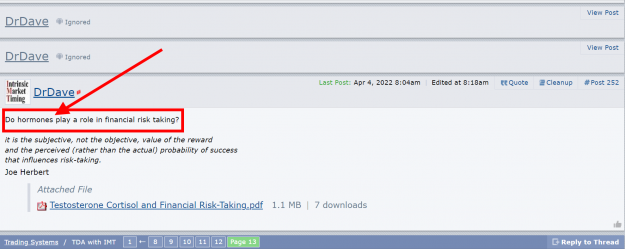
Hey @vnechev -- I have a suggestion to ease your troubles. Head on over to DrDave's IMT Academy thread. He is now lecturing on the role that hormones play in trading -- seriously, I'm not joking, see below. So 'yes', @vnechev, ignore what ...
Trading Made Simple
- robots4me replied Apr 2, 2022
I've modified this indicator and changed the dots to lines... Subtracting the SMA lines from Price action -- i.e. computing the differences or deltas -- has the effect of normalizing data. We are no longer distracted by the absolute price which will ...
Trading Focal Points -- "A Leap Of Faith"...
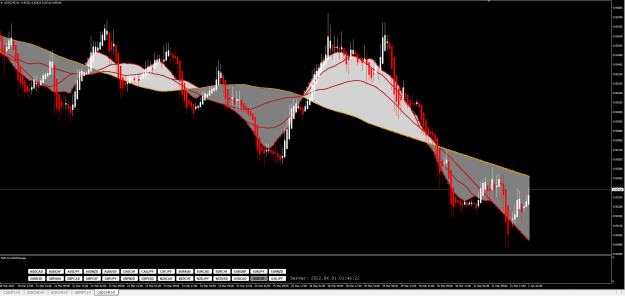
- robots4me replied Apr 2, 2022
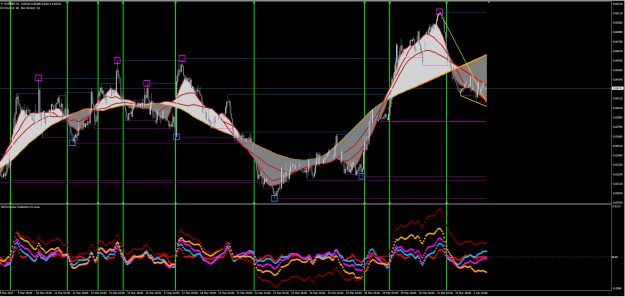
A new indicator -- R4M-Double-TopBottom-Inverse. I like it. I've marked major transitions above / below the zero baseline with vertical green lines. It aligns well with the R4M-Sinewaves-Return-To-Mean indicator (which would be expected), as well as ...
Trading Focal Points -- "A Leap Of Faith"...
- robots4me replied Apr 1, 2022
Thank you, @Swingman. I remember the picture, but forgot the story. I hope you don't mind if I repeat it here -- it made me chuckle again. From @Swingman's post in a different thread (circa 2009) url ...
Trading Focal Points -- "A Leap Of Faith"...

- robots4me replied Apr 1, 2022
You're going to have to put up with me rambling for a moment, and then I'll share the details... Those additional markings are fractals -- but not just any fractals. I debated with myself whether or not to include them in the chart because they have ...
Trading Focal Points -- "A Leap Of Faith"...
- robots4me replied Apr 1, 2022
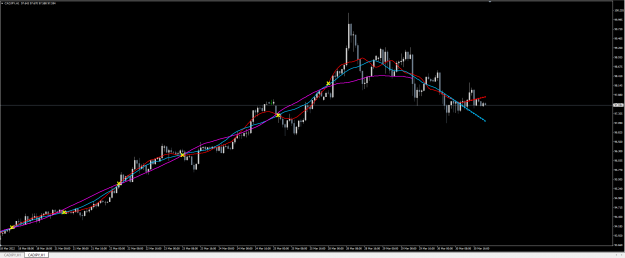
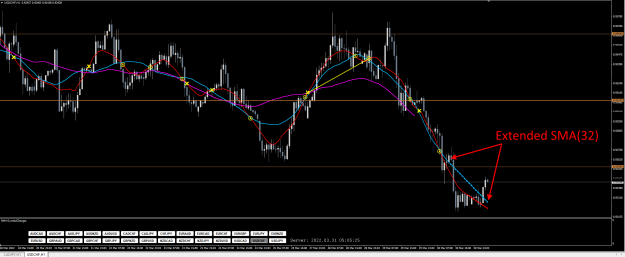
I don't trade below M30, so when it comes to M1 I'm a "fish out of water". Using the Sinewaves-Return-To-Mean indicator it looks to me like a Double Top might be forming. Plus the SMA(128) extension looks to continue to track with PA. So, I'm not ...
Trading Focal Points -- "A Leap Of Faith"...
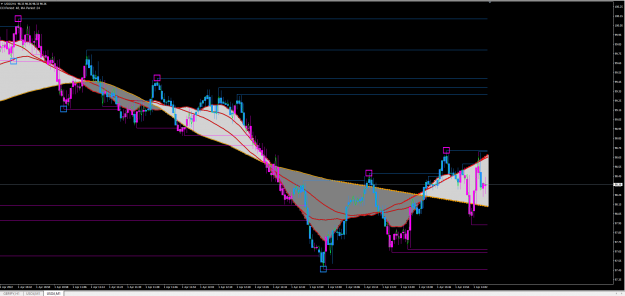
- robots4me replied Mar 31, 2022
Since the shaded surfaces in the R4M-Sinewaves-Return-To-Mean indicator hide the underlying PA, then you might consider overlaying with a Heiken Ashi indicator so you can see the bars. Heiken Ashi provides another benefit -- you get to see the true ...
Trading Focal Points -- "A Leap Of Faith"...
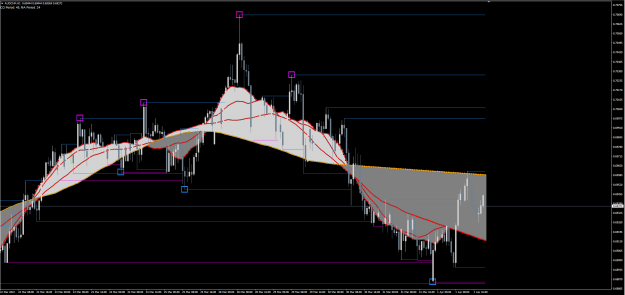
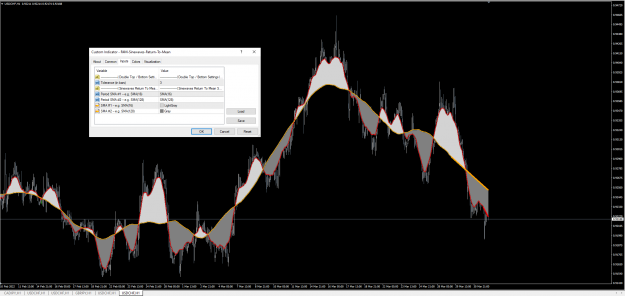
- robots4me replied Mar 31, 2022
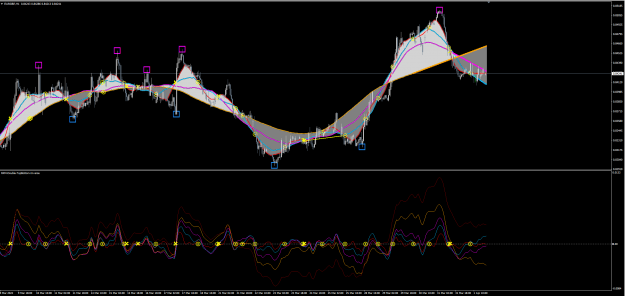
A new indicator -- R4M-Sinewaves-Return-To-Mean. I think you're going to like this one. It is based on @parisboy's post #320 ( url ) where he introduced a new and simple concept -- "Sinewaves Return To Mean". image Note that in the settings you ...
Trading Focal Points -- "A Leap Of Faith"...
- robots4me replied Mar 31, 2022
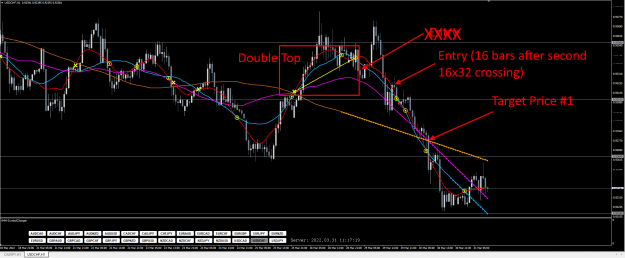
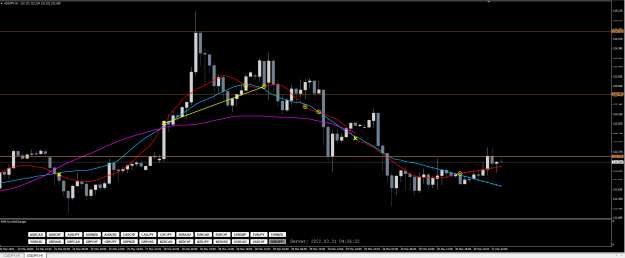
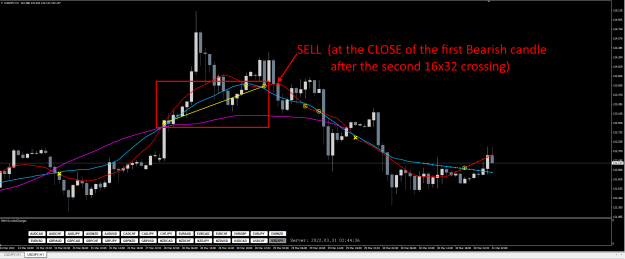
I have a correction to make regarding a chart I had posted earlier. I had marked as a potential entry for a Double Top the close of the first bearish bar after the second 16x32 cross. In fact, there is no way you could enter that early. The reason ...
Trading Focal Points -- "A Leap Of Faith"...
- robots4me replied Mar 31, 2022
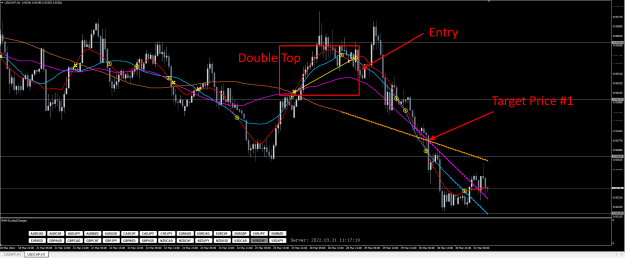
Updated version of the R4M-DoubleTop indicator. This version includes SMA(128) and its extension. So, now, we have it all... (1) Detect simple Double Top / Bottom (16x32x64 crossing, followed by two 16x32 crossings) (2) Entry (after close of bearish ...
Trading Focal Points -- "A Leap Of Faith"...
- robots4me replied Mar 31, 2022
Just as in real-life, everything comes with a trade-off. And that is true of Focal Points and Double Tops / Bottoms, as well. The trade-off has been mentioned many times before, but is worth reminding readers... The SMA lines are backshifted by 1/2 ...
Trading Focal Points -- "A Leap Of Faith"...
- robots4me replied Mar 30, 2022
Below is a chart where I've combined the latest DTB indicator with @Nih98's sweet spot indicator. @Nih98 was a good friend and a mentor to many at FF. He died a young man a few years ago. @Nih98 developed a ton of software that he freely shared. His ...
Trading Focal Points -- "A Leap Of Faith"...
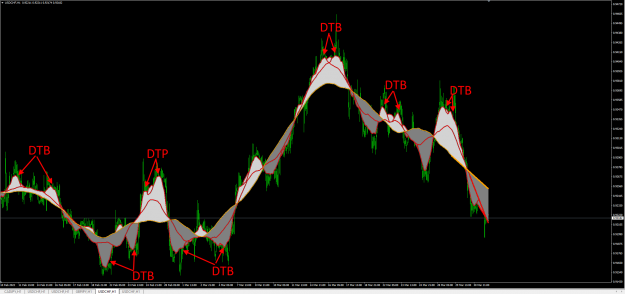
- robots4me replied Mar 30, 2022
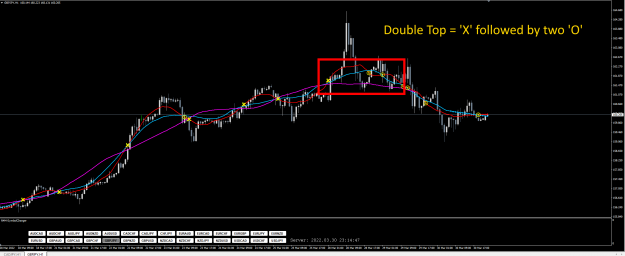
Updated version of the Double Top / Bottom indicator -- I'm not sure how much further I can take it. The one thing it still misses is a guesstimated Target Price. This version identifies the most RECENT Double Top / Bottom, where a DTB is defined ...
Trading Focal Points -- "A Leap Of Faith"...
- robots4me replied Mar 30, 2022
Next version of the DTB indicator. Now it's getting closer to detecting a valid, though simple Double Top / Bottom. Algorithmically, I'm defining a DTB as a 16x32x64 crossing followed by two 16x32 crossings. In the chart below 16x32x64 crossings are ...
Trading Focal Points -- "A Leap Of Faith"...
- robots4me replied Mar 30, 2022
A new indicator -- R4M-Double-TopBottom. This is a work in progress, so don't book your Hawaiian vacation quite yet. This initial version simply detects 16x32x64 crossings that typically precede Double Tops / Bottoms. The crossings are marked with a ...
Trading Focal Points -- "A Leap Of Faith"...